 FRACTAL FIND
CHAPTER 11
Fractal-Lorenz Map
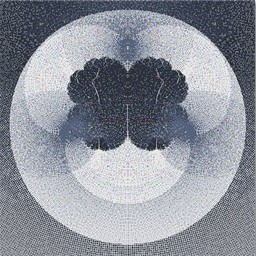
A Fractal-Lorenz Map is a combination of a fractal figure and Lorenz calculations.
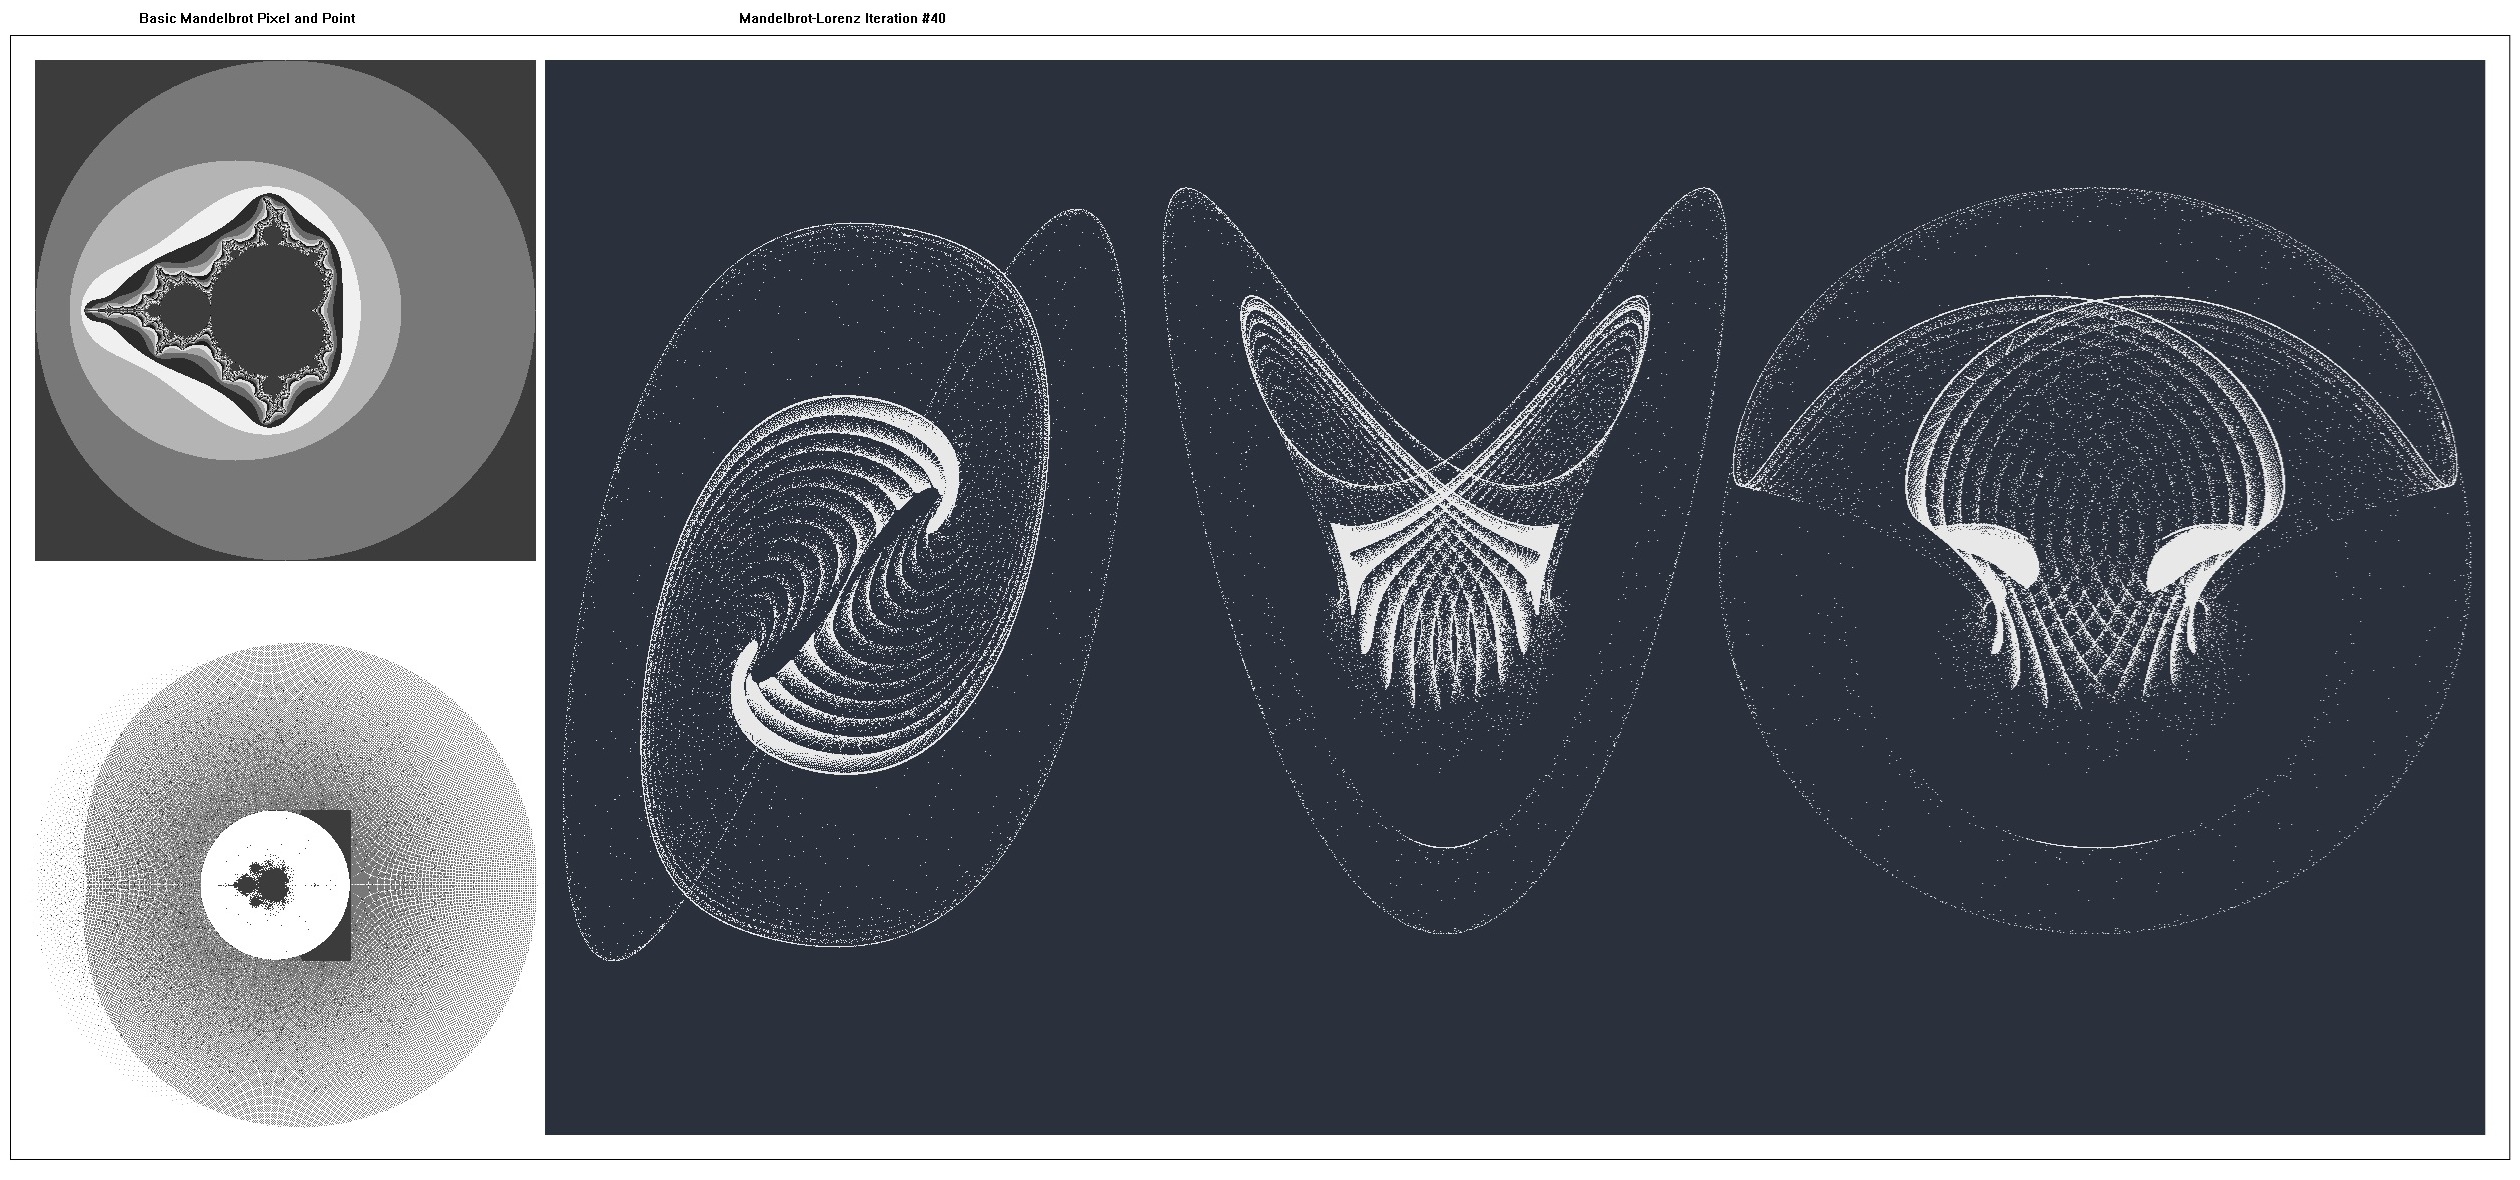
On the left-hand side, the Mandelbrot pixel and point figures are presented and pseudocode is shown.
One hundred iterations of the Mandelbrot-Lorenz Map were generated with the map plotted each ten iterations.
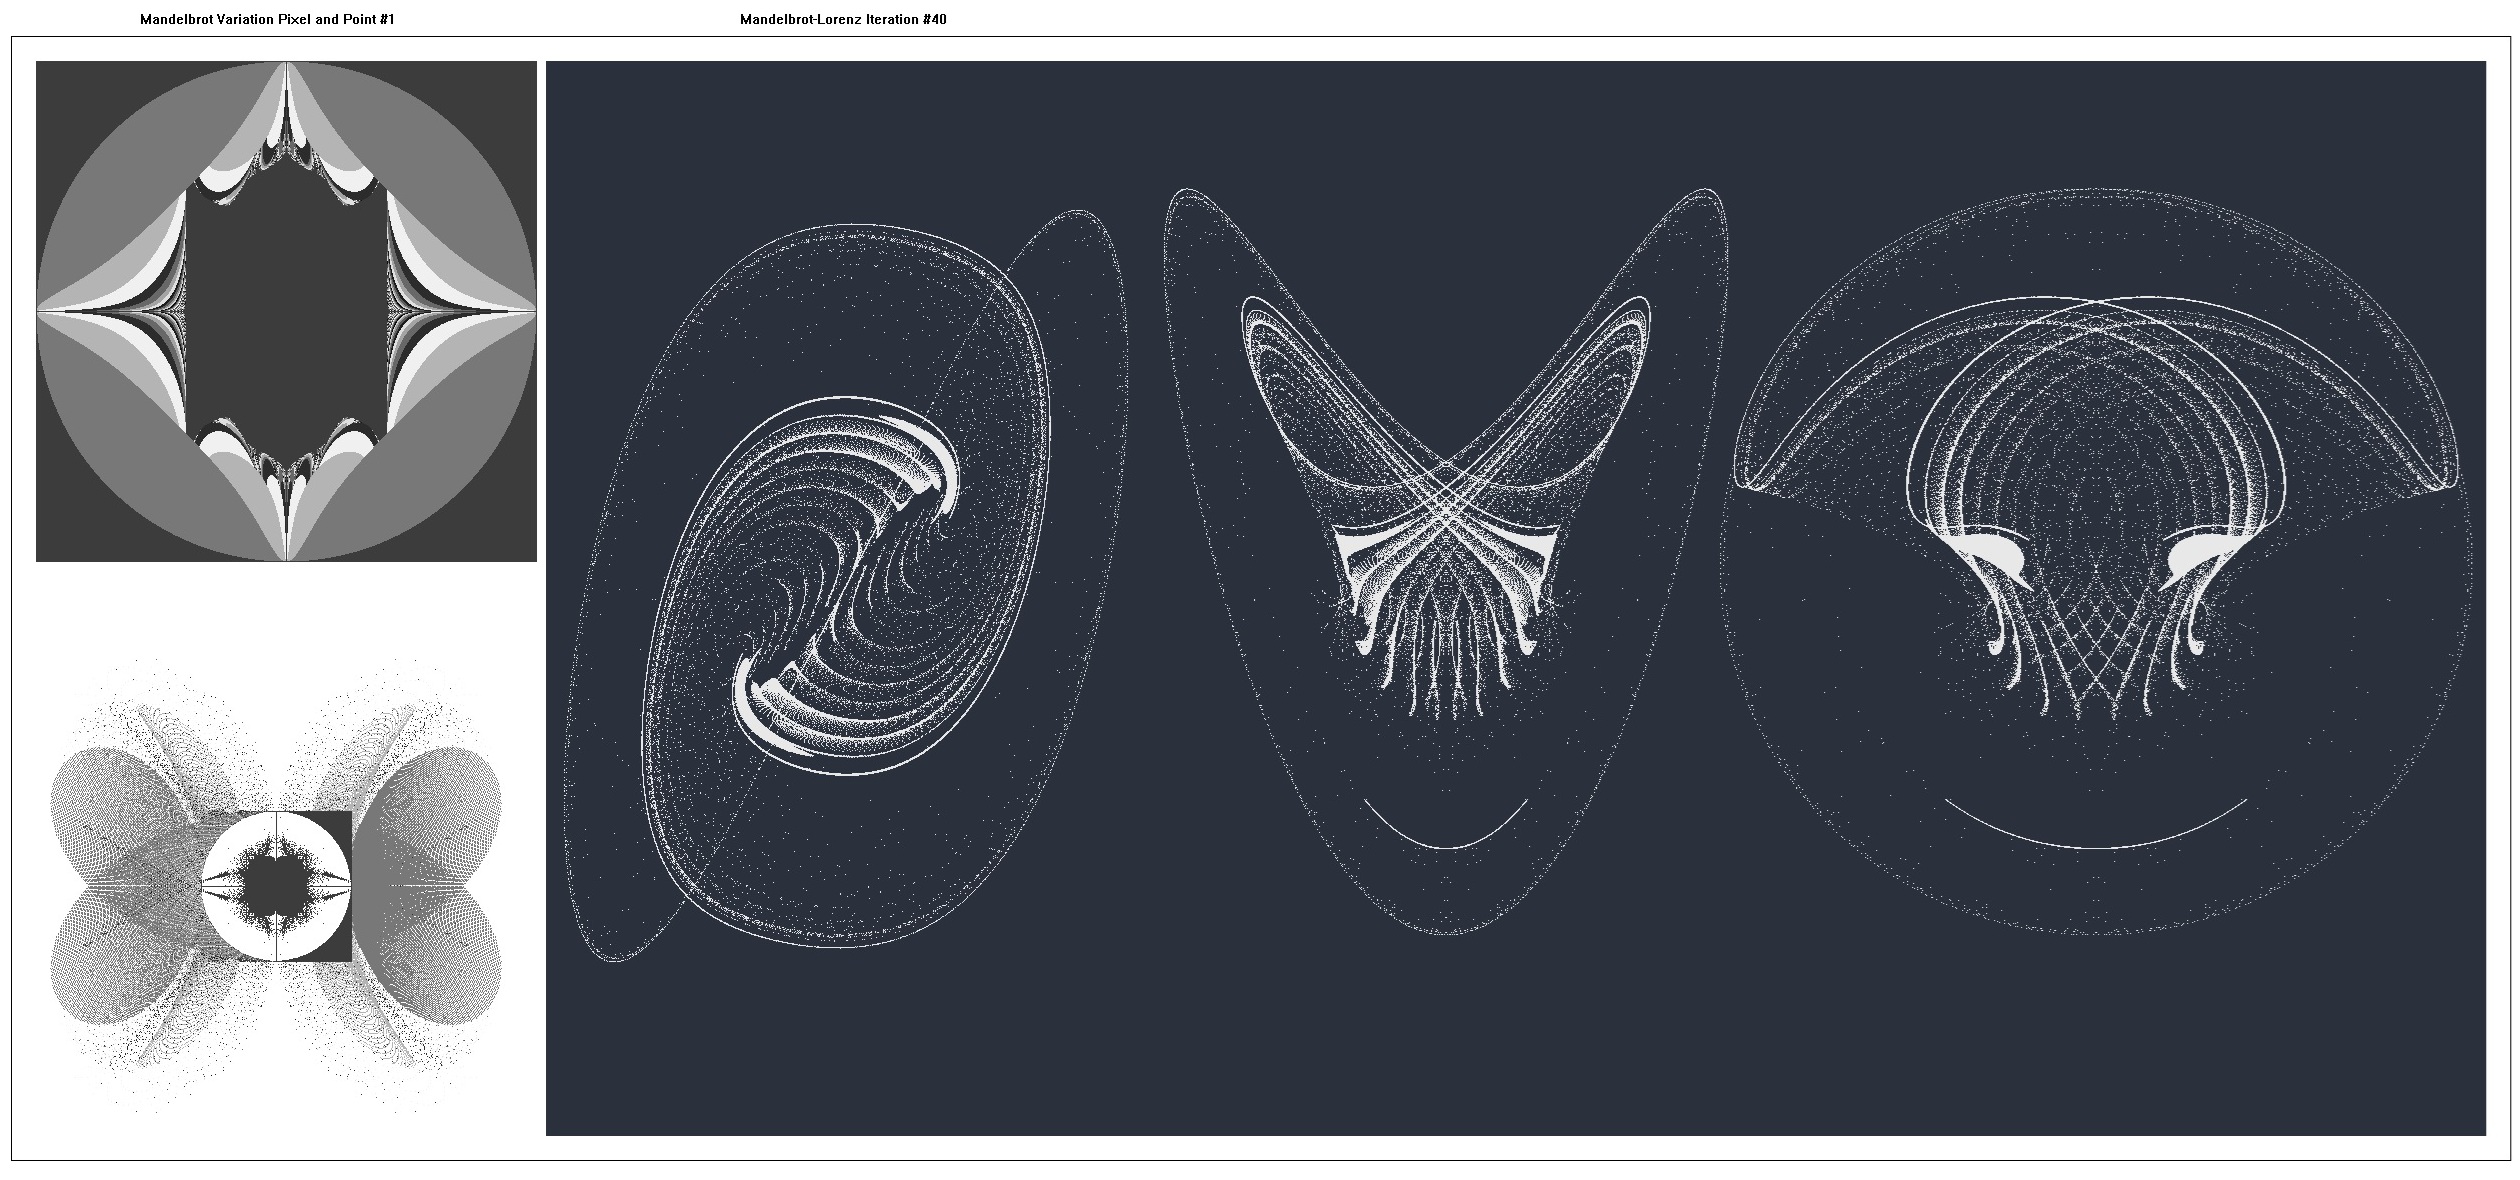
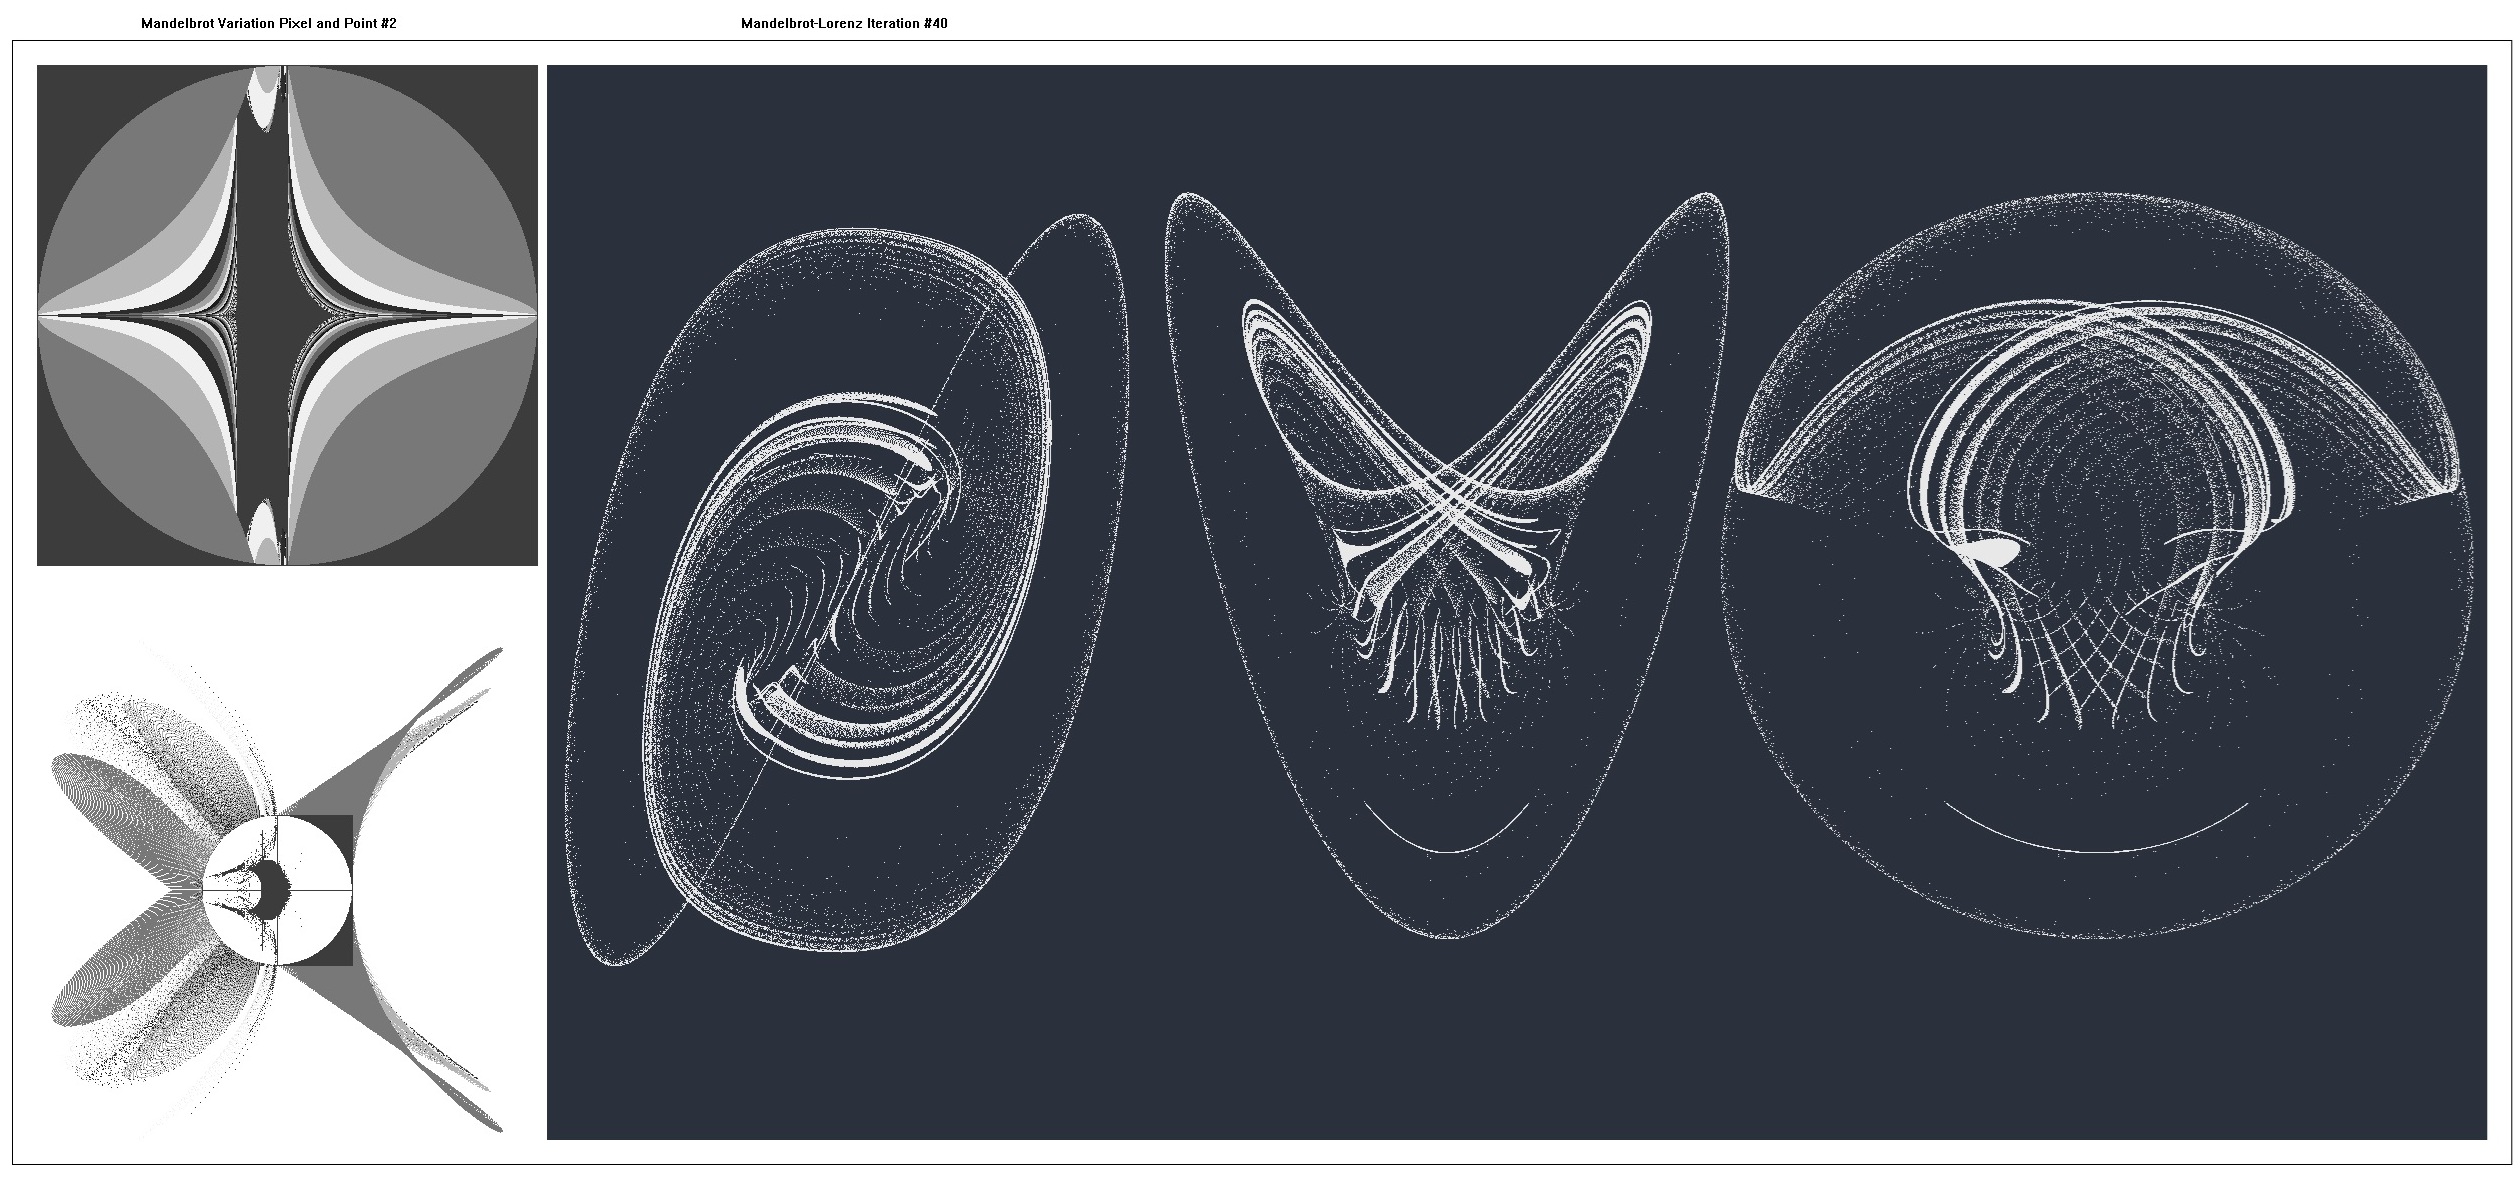
On the right-hand side, the Mandelbrot-Lorenz Map at 40 iterations is presented (X-Y, X-Z, Y-Z respectively) and pseudocode is shown where:
- dt=0.02
- r=28.0
- s=10.0
- b=2.667
Mandelbrot Pixel and Point

for (int i = 0; i ≤ 500; i++)
{
	for (int j = 0; j ≤ 500; j++)
	{
		x = 0.0;
		y = 0.0;
		xs = -2.5 + (i / 100.0);
		ys = -2.5 + (j / 100.0);
		k = 0;
		do
		{
            		xnew = x*x - y*y + xs;
            		ynew = 2.0*x*y + ys;
			x = xnew;
			y = ynew;
			k = k + 1;
		} while ((k ≤ 64) && (x*x + y*y ≤ 6.25));
		xarray[i][j] = x;
		yarray[i][j] = y;
		zarray[i][j] = k;
		PlotPixel(i, j, color);
		PlotPoint(x, y, color);
	}
}
Mandelbrot-Lorenz Map

for (int m = 1; m ≤ 100; m++)
{
	for (int i = 0; i ≤ 500; i++)
	{
		for (int j = 0; j ≤ 500; j++)
		{
			x = xarray[i][j];
			y = yarray[i][j];
			z = zarray[i][j];
			dx = s * (y - x);
			dy = r * x - y - x * z;
			dz = x * y - b * z;
			xarray[i][j] = x = x + dx * dt;
			yarray[i][j] = y = y + dy * dt;
			zarray[i][j] = z = z + dz * dt;
			if (m % 10 == 0)
			{
				PlotPoint(x, y, color);
				PlotPoint(x, z, color);
				PlotPoint(y, z, color);
			}
		}
	}
}
| Mandelbrot | Build: (f(x,y), g(x,y)) | Escape: h(x,y)>value | Plot |
|---|---|---|---|
| Basic Mandelbrot Set | (x² - y², 2.0*x*y) | x² + y² > 6.25 | Pixel, Point, Lorenz |
| Mandelbrot Variant #1 | (x*y², -y*x²) | x³ + y² > 6.25 | Pixel, Point, Lorenz |
| Mandelbrot Variant #2 | (x*y², 2.0*x*y) | x³ + y² > 6.25 | Pixel, Point, Lorenz |
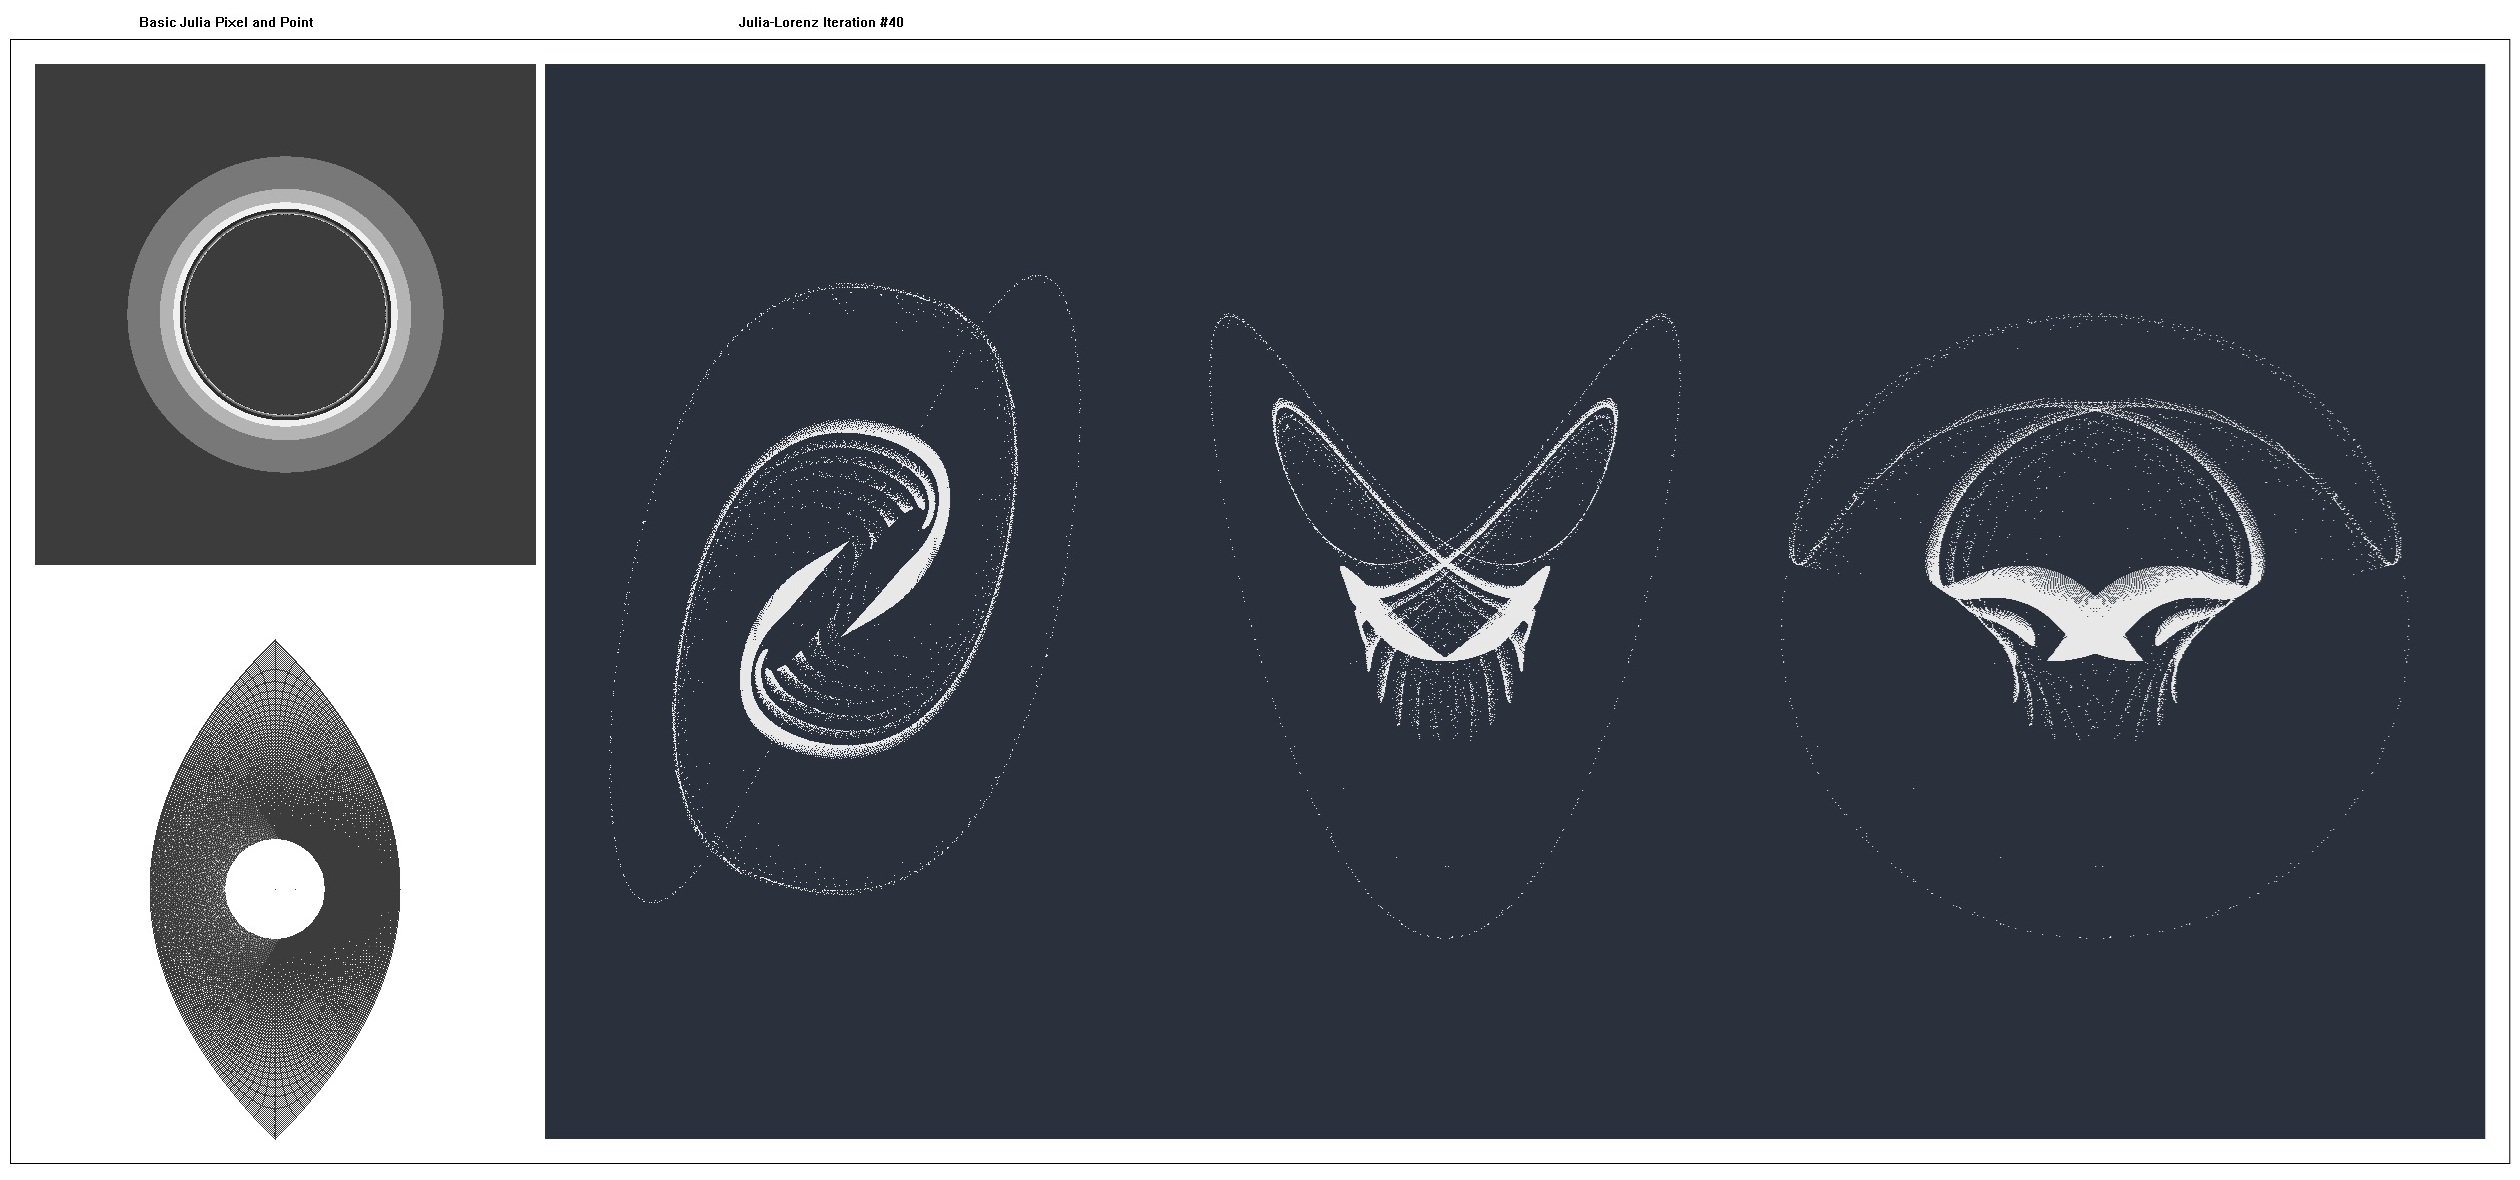
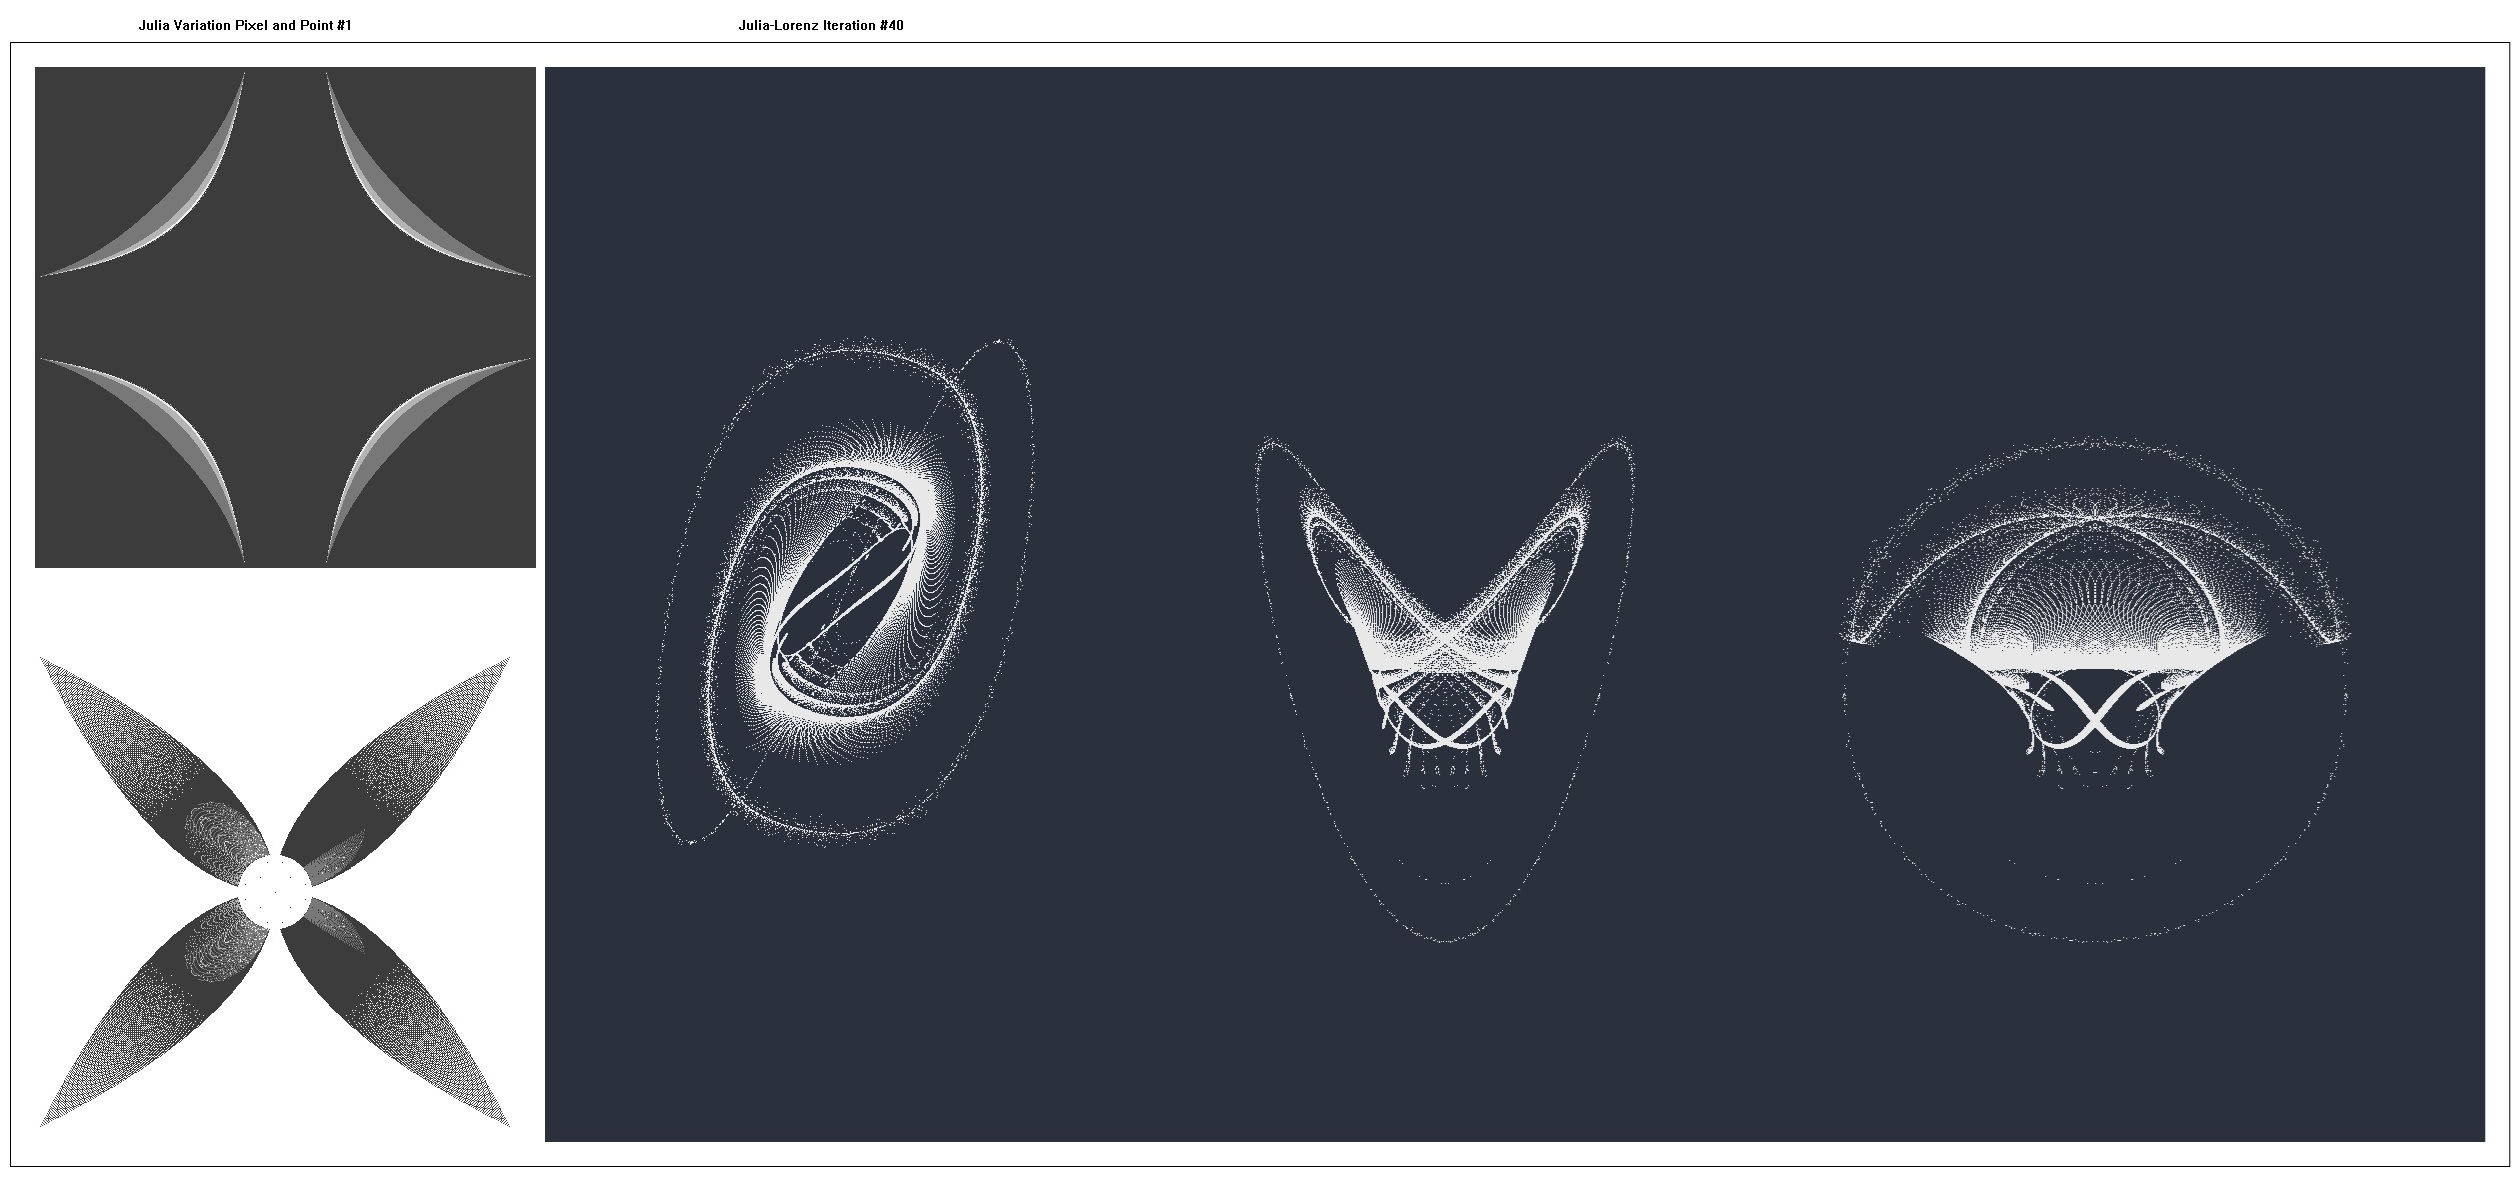
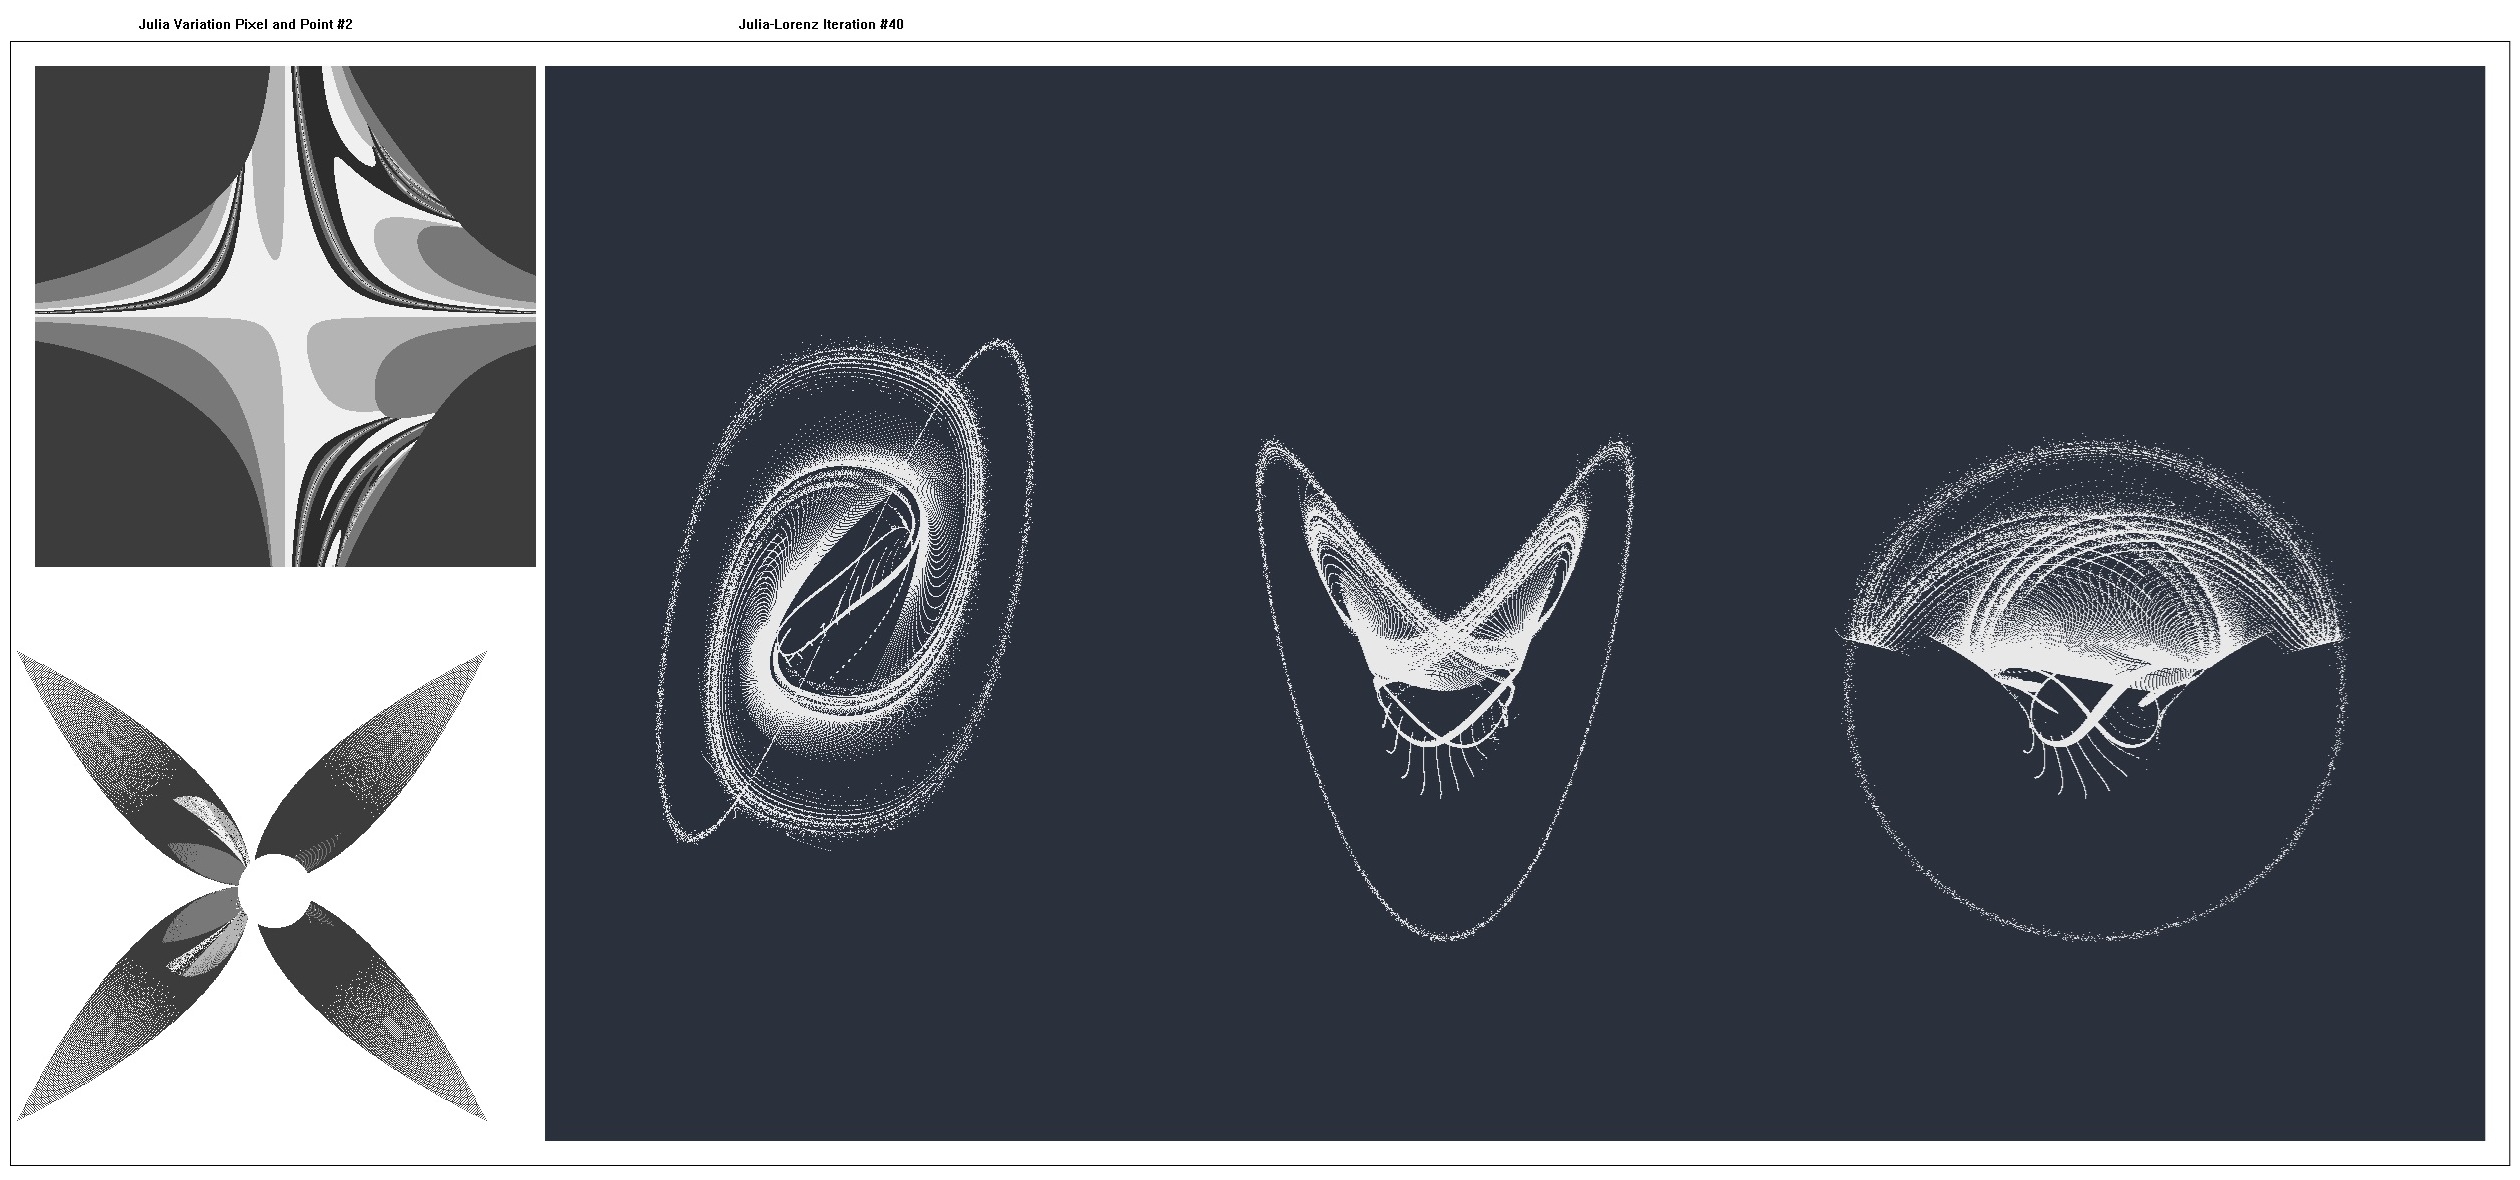
On the left-hand side, the Julia pixel and point figures are presented and pseudocode is shown.
One hundred iterations of the Julia-Lorenz Map were generated with the map plotted each ten iterations.
On the right-hand side, the Julia-Lorenz Map at 40 iterations is presented (X-Y, X-Z, Y-Z respectively) and pseudocode is shown where:
- dt=0.02
- r=28.0
- s=10.0
- b=2.667
Julia Pixel and Point

for (int i = 0; i ≤ 500; i++)
{
	for (int j = 0; j ≤ 500; j++)
	{
		xs = 0.0;
		ys = 0.0;
		x = -2.5 + (i / 100.0);
		y = -2.5 + (j / 100.0);
		k = 0;
		do
		{
            		xnew = x*x - y*y + xs;
            		ynew = 2.0*x*y + ys;
			x = xnew;
			y = ynew;
			k = k + 1;
		} while ((k ≤ 64) && (x*x + y*y ≤ 6.25));
		xarray[i][j] = x;
		yarray[i][j] = y;
		zarray[i][j] = k;
		PlotPixel(i, j, color);
		PlotPoint(x, y, color);
	}
}
Julia-Lorenz Map

for (int m = 1; m ≤ 100; m++)
{
	for (int i = 0; i ≤ 500; i++)
	{
		for (int j = 0; j ≤ 500; j++)
		{
			x = xarray[i][j];
			y = yarray[i][j];
			z = zarray[i][j];
			dx = s * (y - x);
			dy = r * x - y - x * z;
			dz = x * y - b * z;
			xarray[i][j] = x = x + dx * dt;
			yarray[i][j] = y = y + dy * dt;
			zarray[i][j] = z = z + dz * dt;
			if (m % 10 == 0)
			{
				PlotPoint(x, y, color);
				PlotPoint(x, z, color);
				PlotPoint(y, z, color);
			}
		}
	}
}
| Julia | Build: (f(x, y), g(x, y), (xs, ys)) | Escape: h(x, y)>value | Plot |
|---|---|---|---|
| Basic Julia Set (0.0, 0.0) | (x² - y², 2.0*x*y), (0.0, 0.0) | x² + y² > 6.25 | Pixel, Point, Lorenz |
| Julia Variant #1 | (x*y², -y*x²), (0.0, 0.0) | x² + y² > 6.25 | Pixel, Point, Lorenz |
| Julia Variant #2 | (x*y², -y*x²), (-1.540, 0.320) | x² + y² > 6.25 | Pixel, Point, Lorenz |
Resource for Lorenz calculations:
https://en.wikipedia.org/wiki/Lorenz_system