 FRACTAL FIND
CHAPTER 6
Fractal Fold Variations
Trigonometric functions create folds.
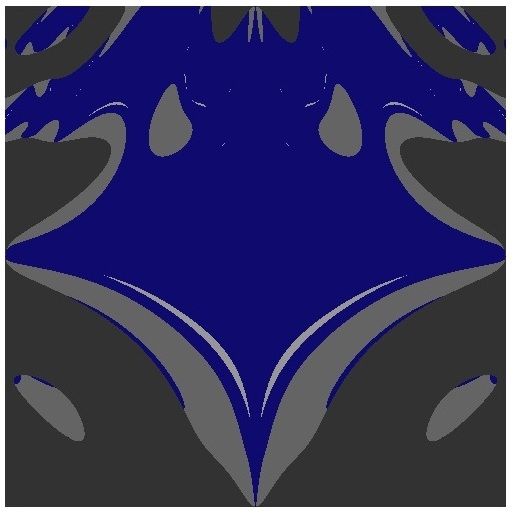
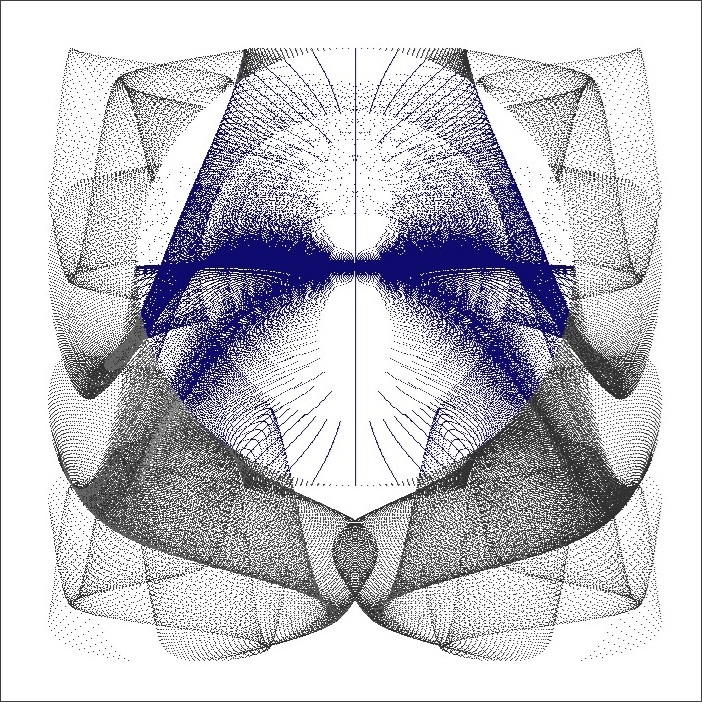
Both the Mandelbrot fold figures and the Julia fold figures use pixel dimensions that are increased by 100 pixels in both the x-direction and the y-direction for each figure.
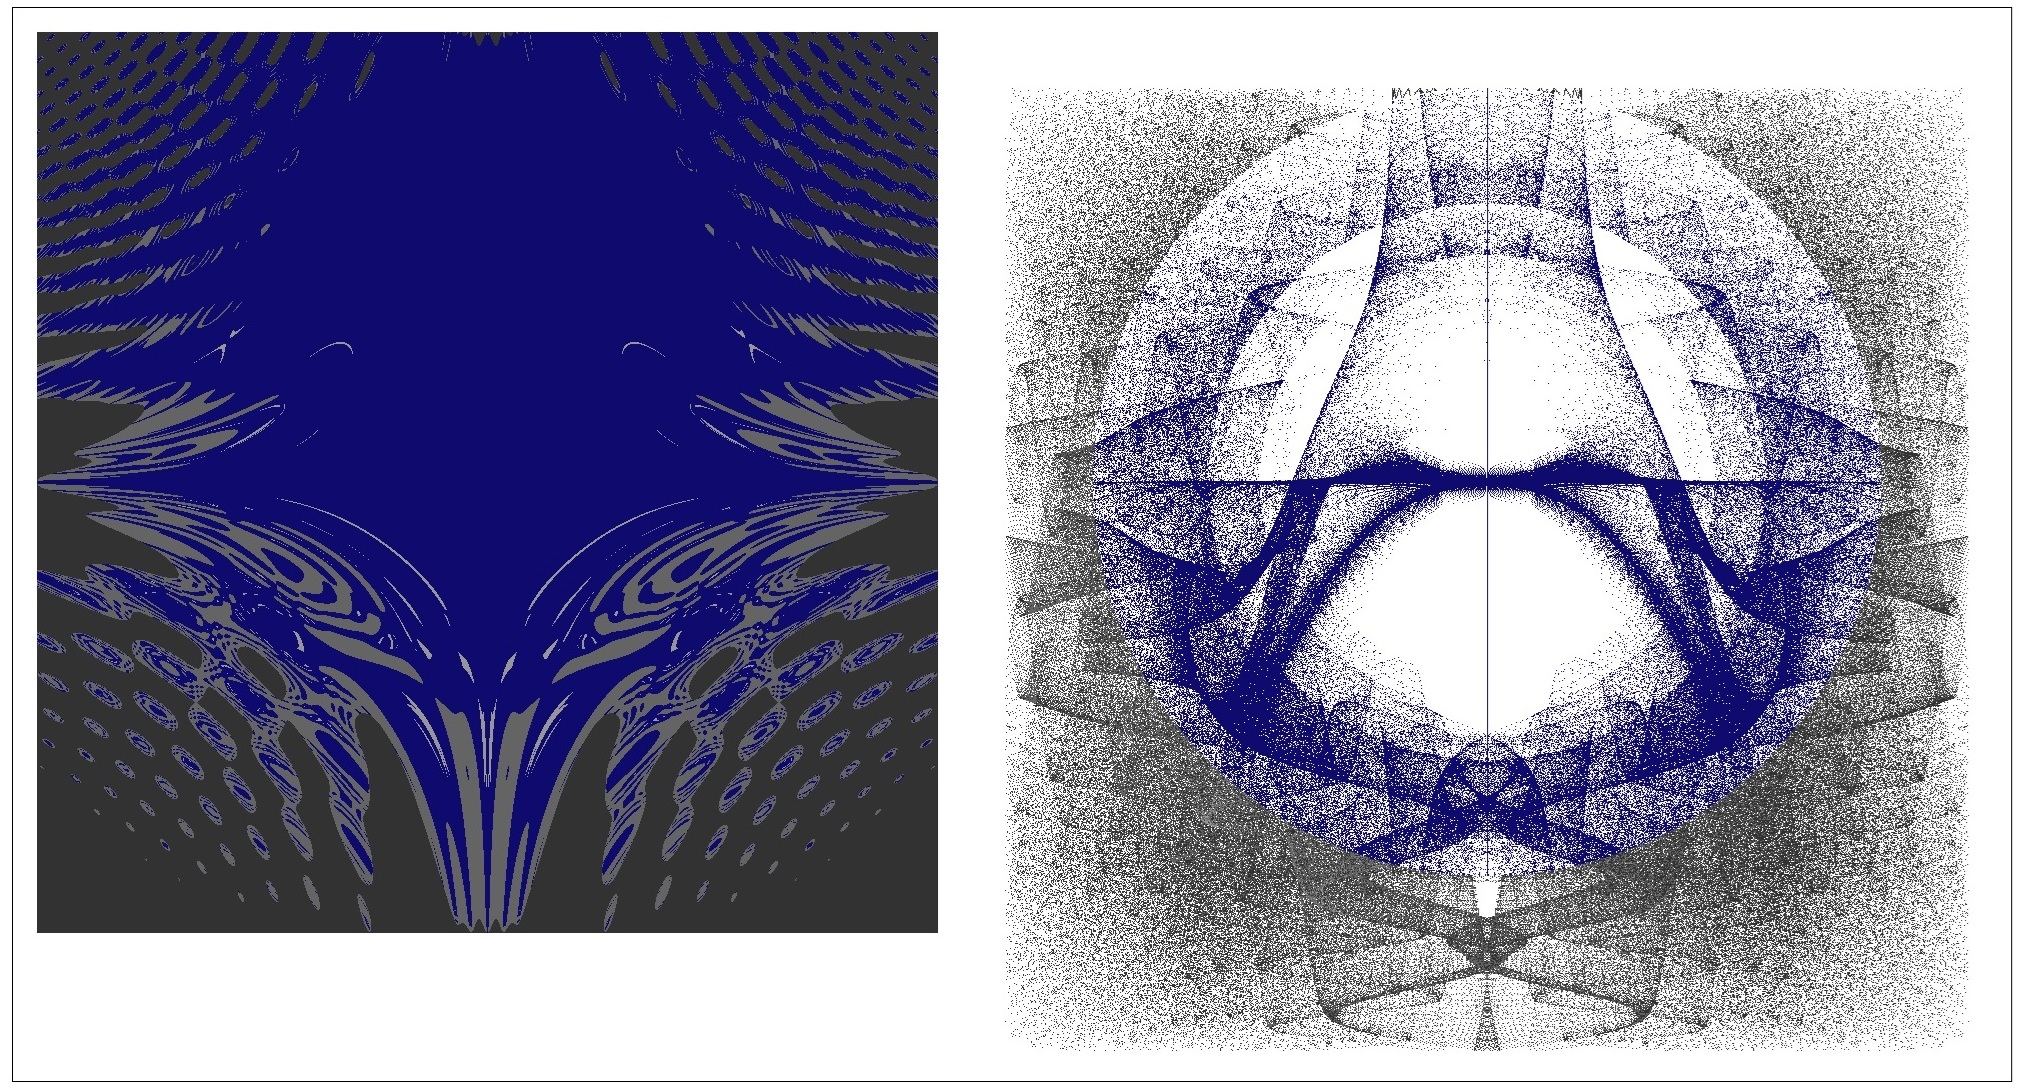
When the pixel dimension is increased, the number of folds also increases.
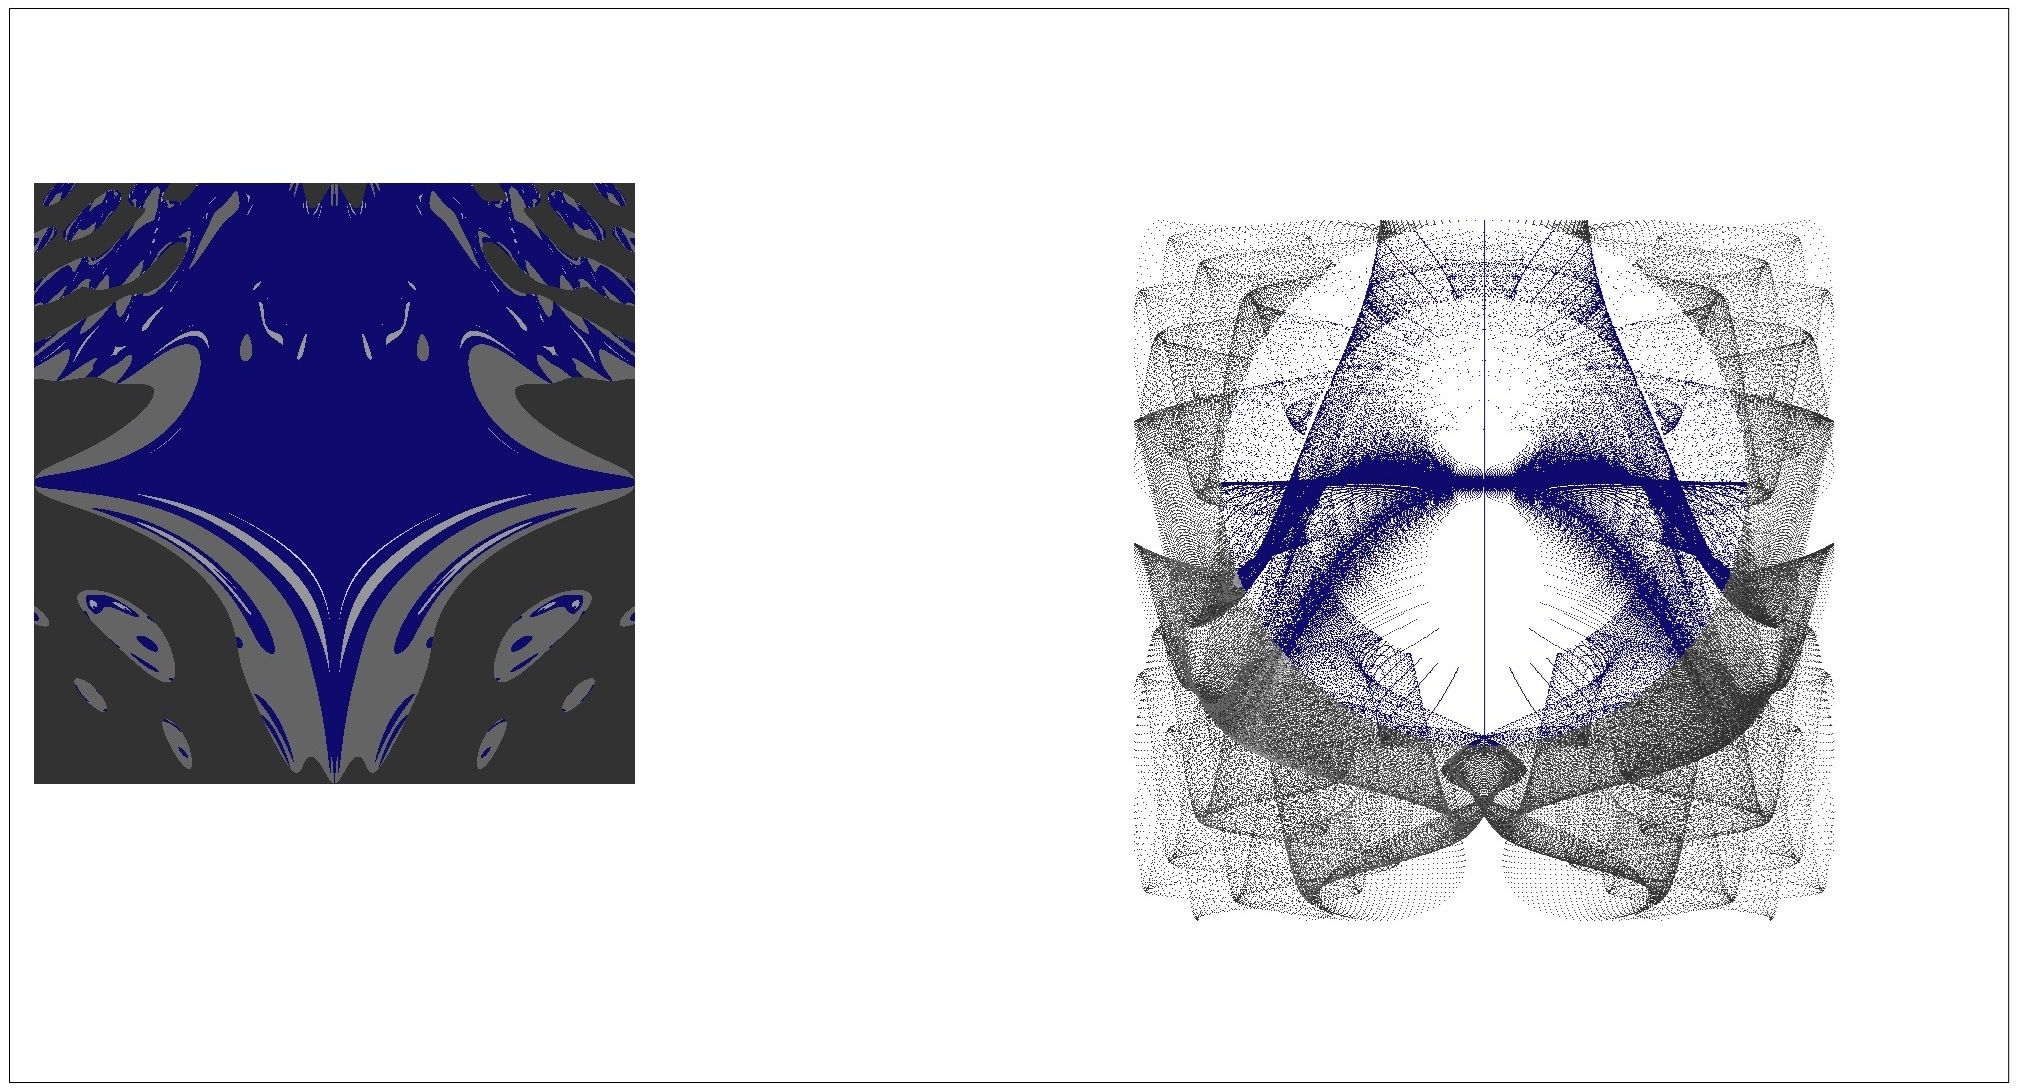
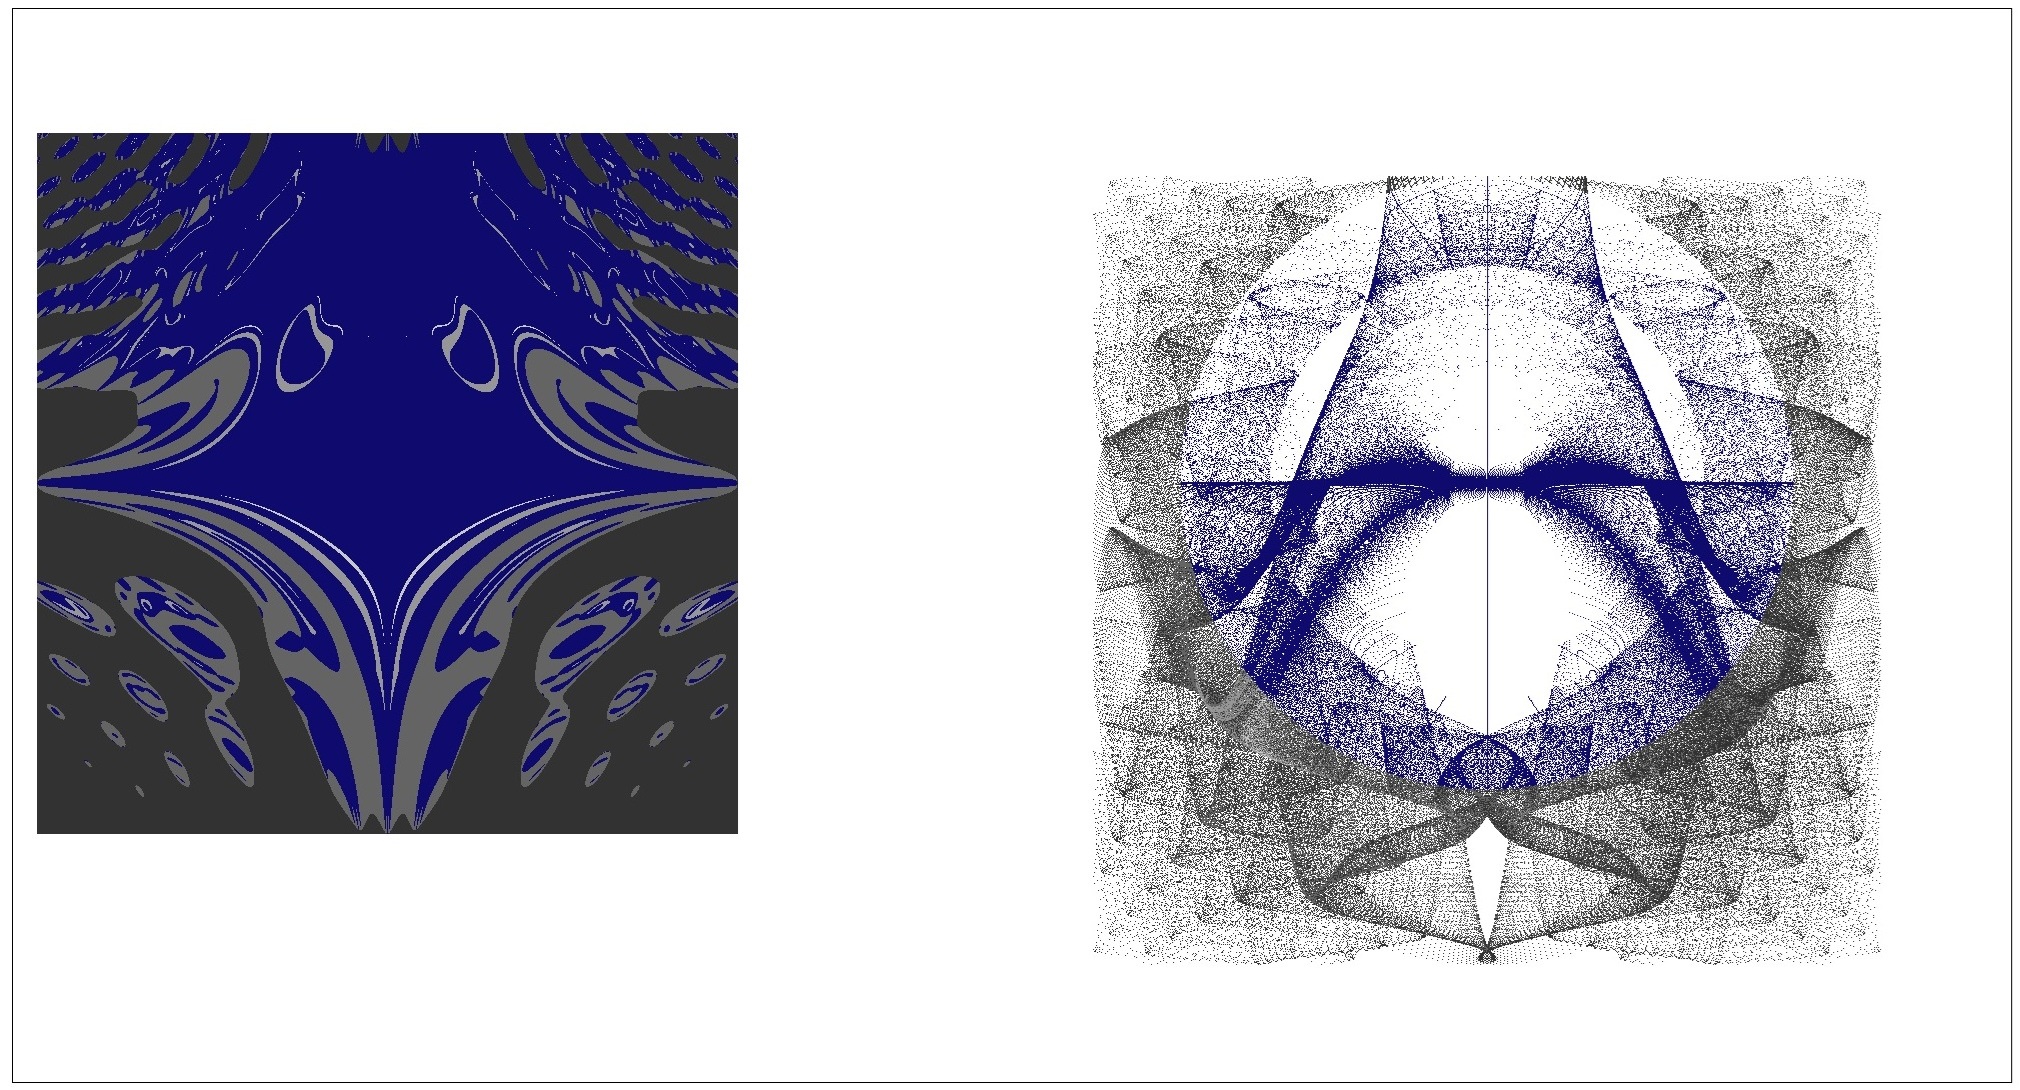
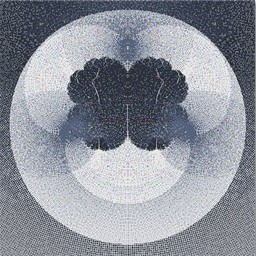
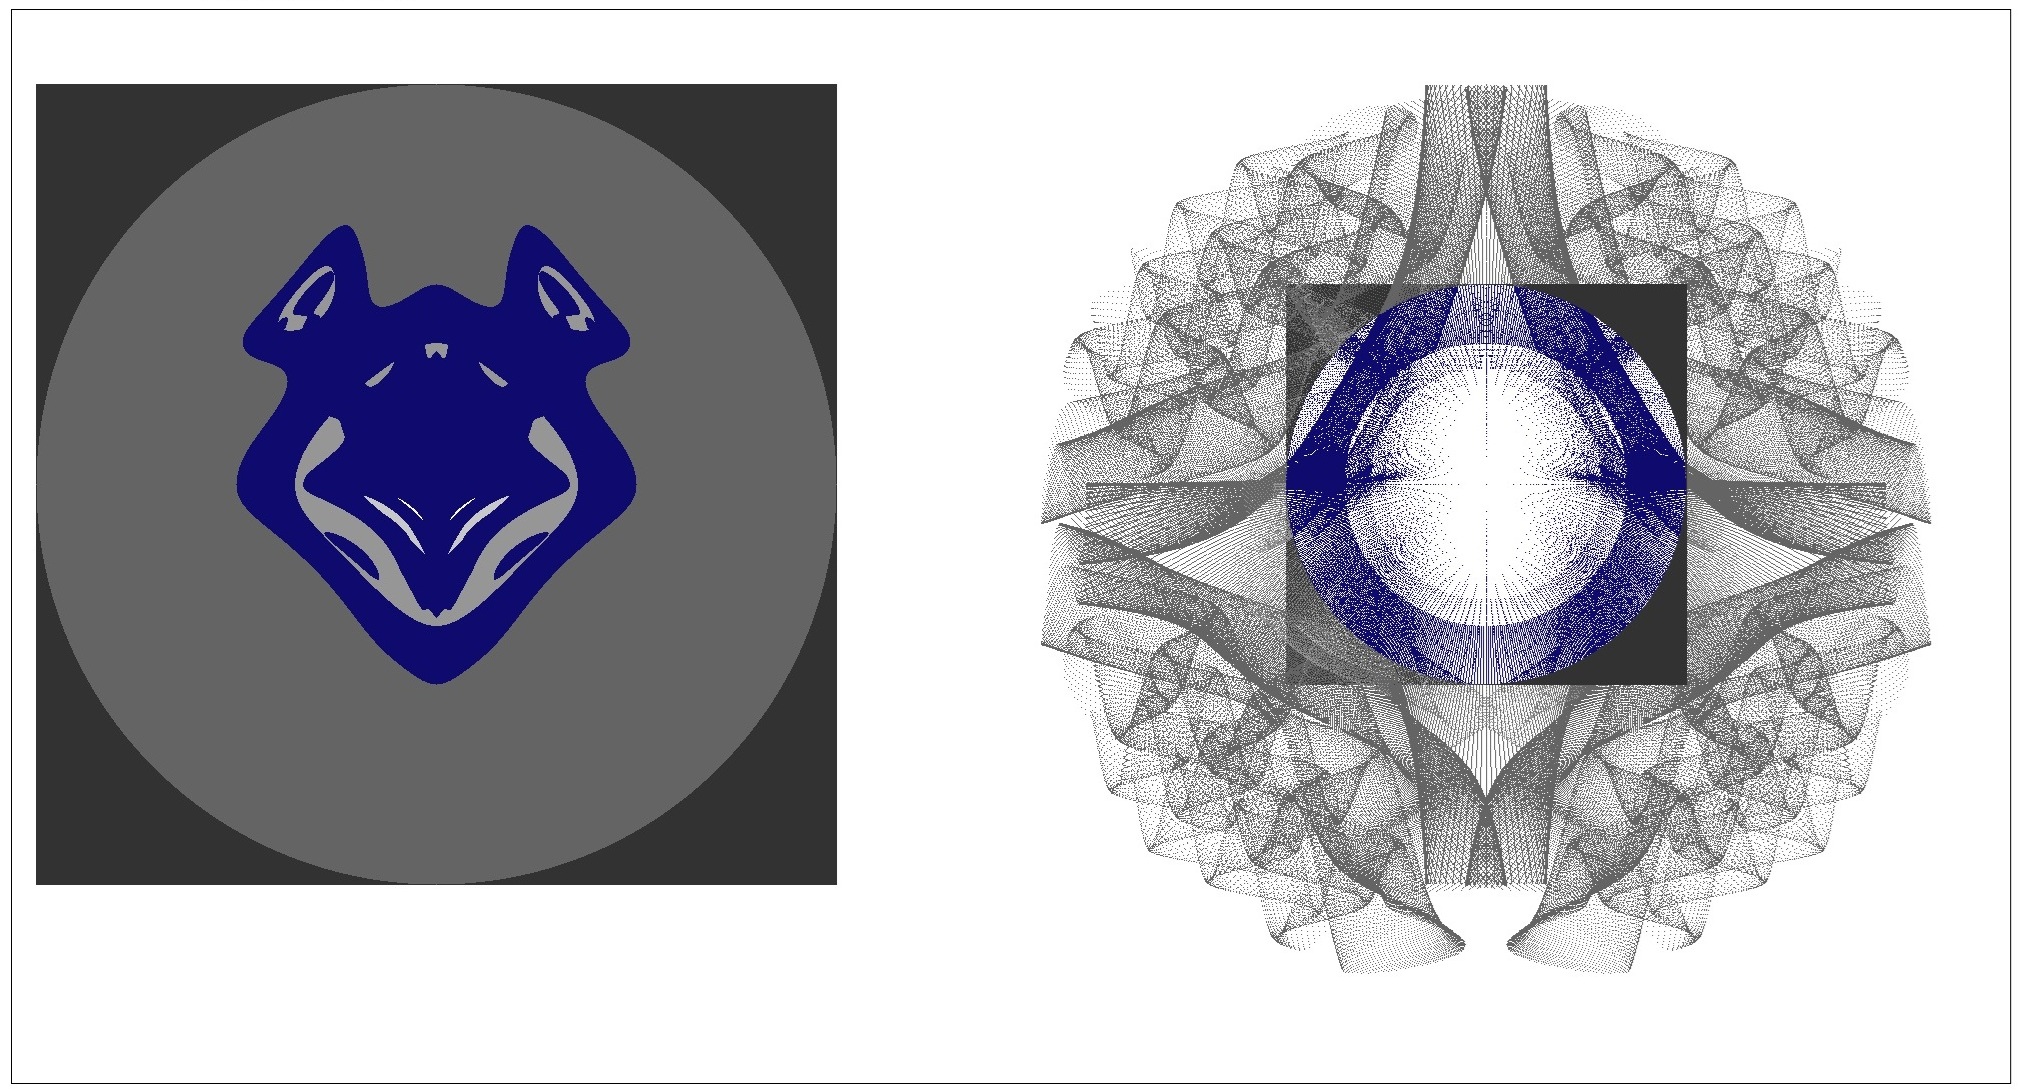
 Mandelbrot Point showing Folds Example
- Build: (x+sin(y*x*y)+xs, y+cos(x*x*y)-1.0+ys)
- Escape: x²+y² > (2.5+m/2.0)²/k
for (int m = 0; m ≤ 4; m++)
{
	for (int i = 0; i ≤ 500+m*100; i++)
	{
		for (int j = 0; j ≤ 500+m*100; j++)
		{
			x = 0.0;
			y = 0.0;
			xs = -2.5 - m/2.0 + (i/100.0);
			ys = -2.5 - m/2.0 + (j/100.0);
			k = 0;
			do
			{
				xnew = x + sin(y*x*y) + xs;
				ynew = y + cos(x*x*y) - 1.0 + ys;
				x = xnew;
				y = ynew;
				k = k + 1;
			} while ((k ≤ kmax) && (x²+y² ≤ (2.5+m/2.0)²/k));
			color = gray;
			if (x²+y² ≤ (2.5+m/2.0)²) color = blue;
			PlotPixel(i, j, color);
			PlotPoint(x, y, color);
		}
	}
}
See Appendix F for additional fold (Seashell) figures.
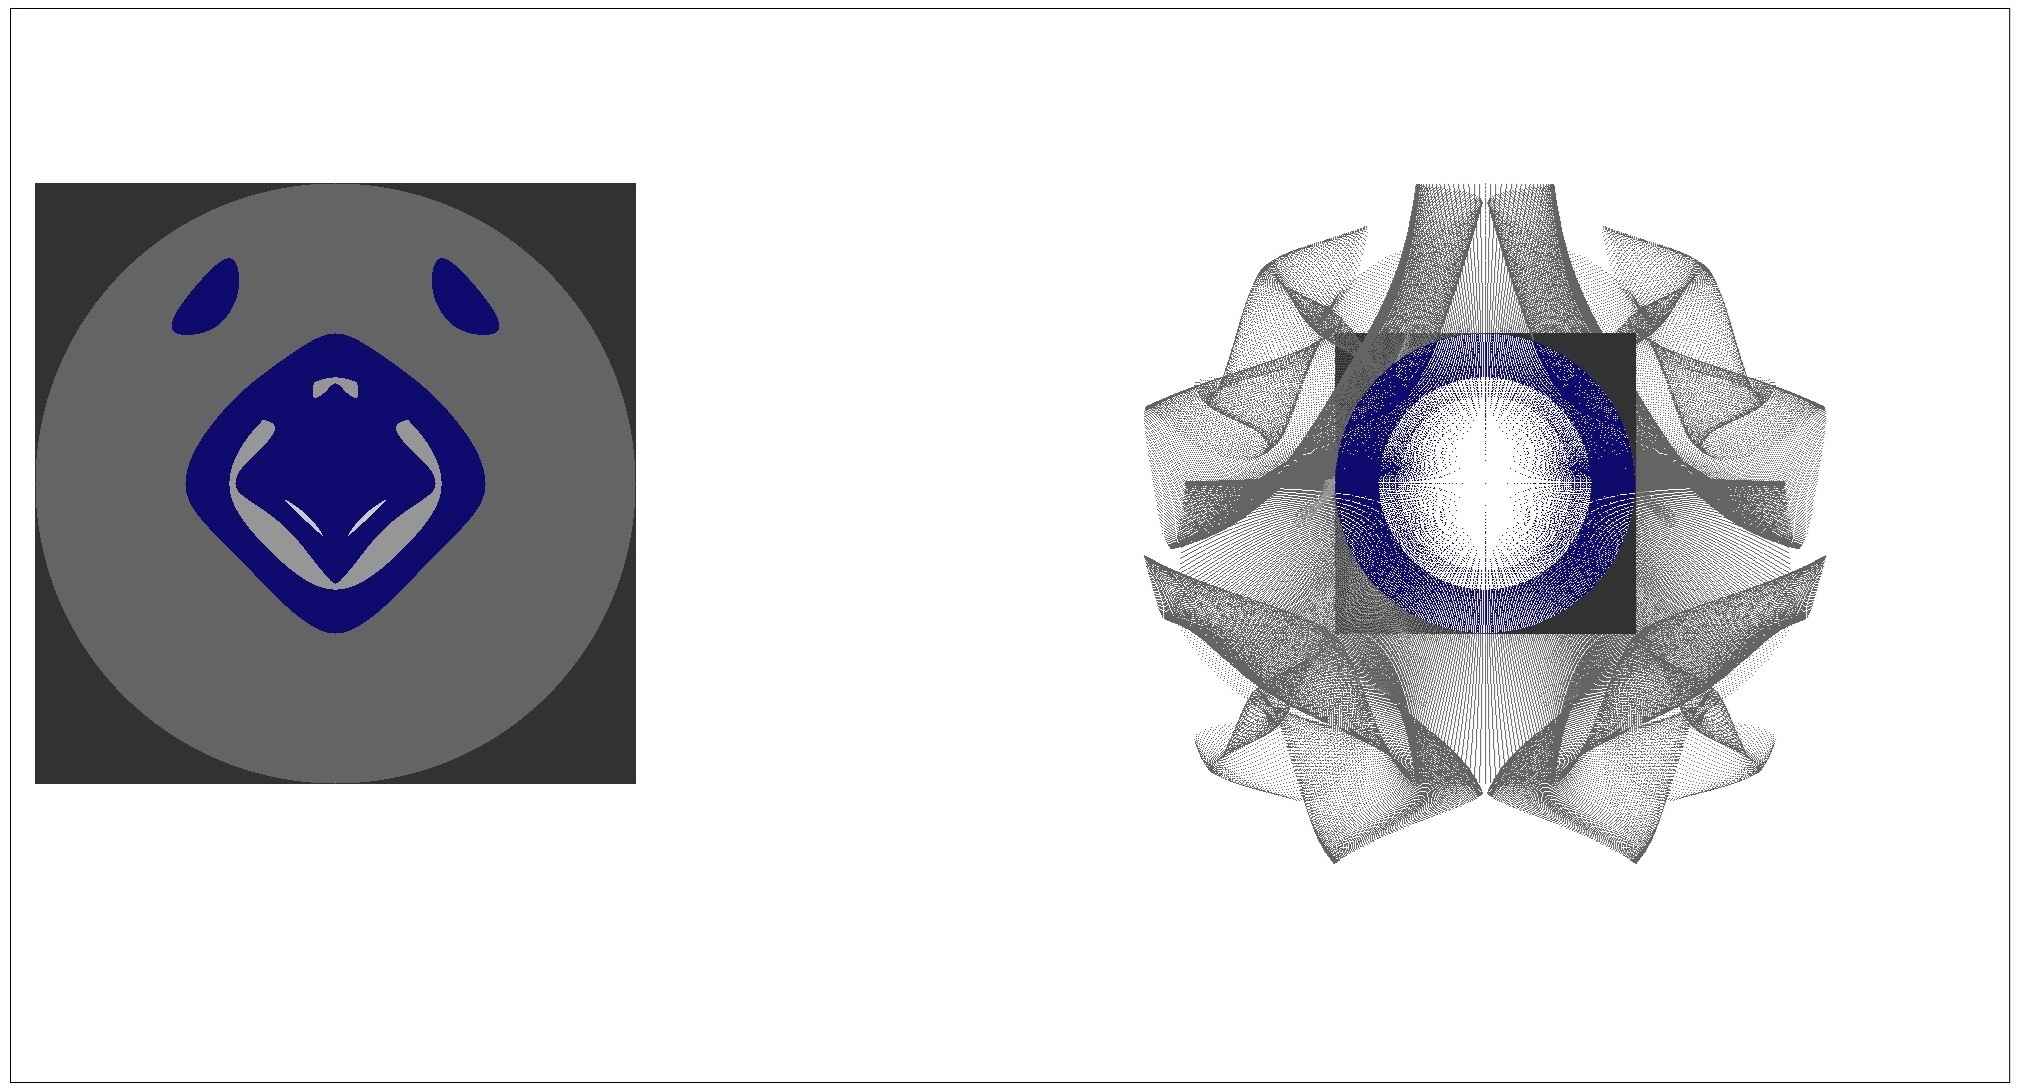
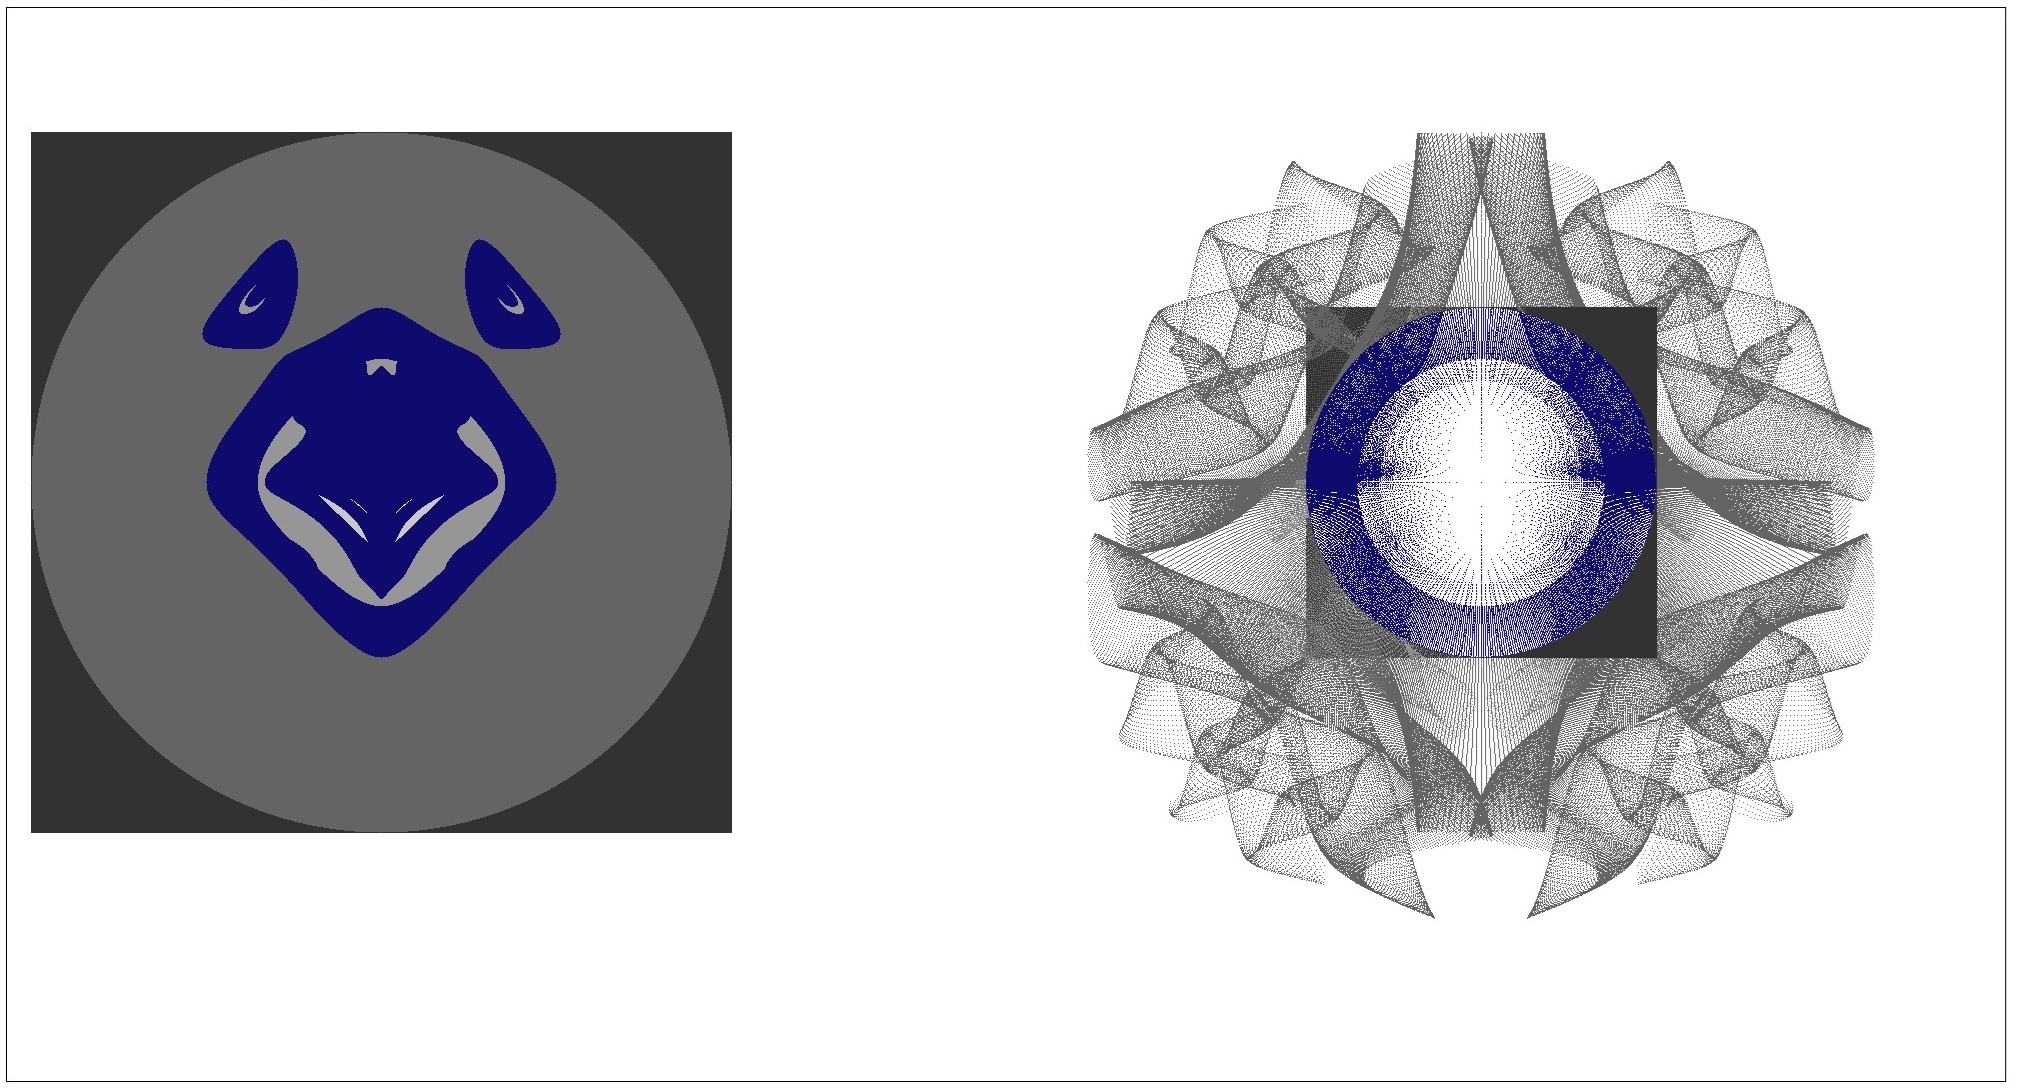
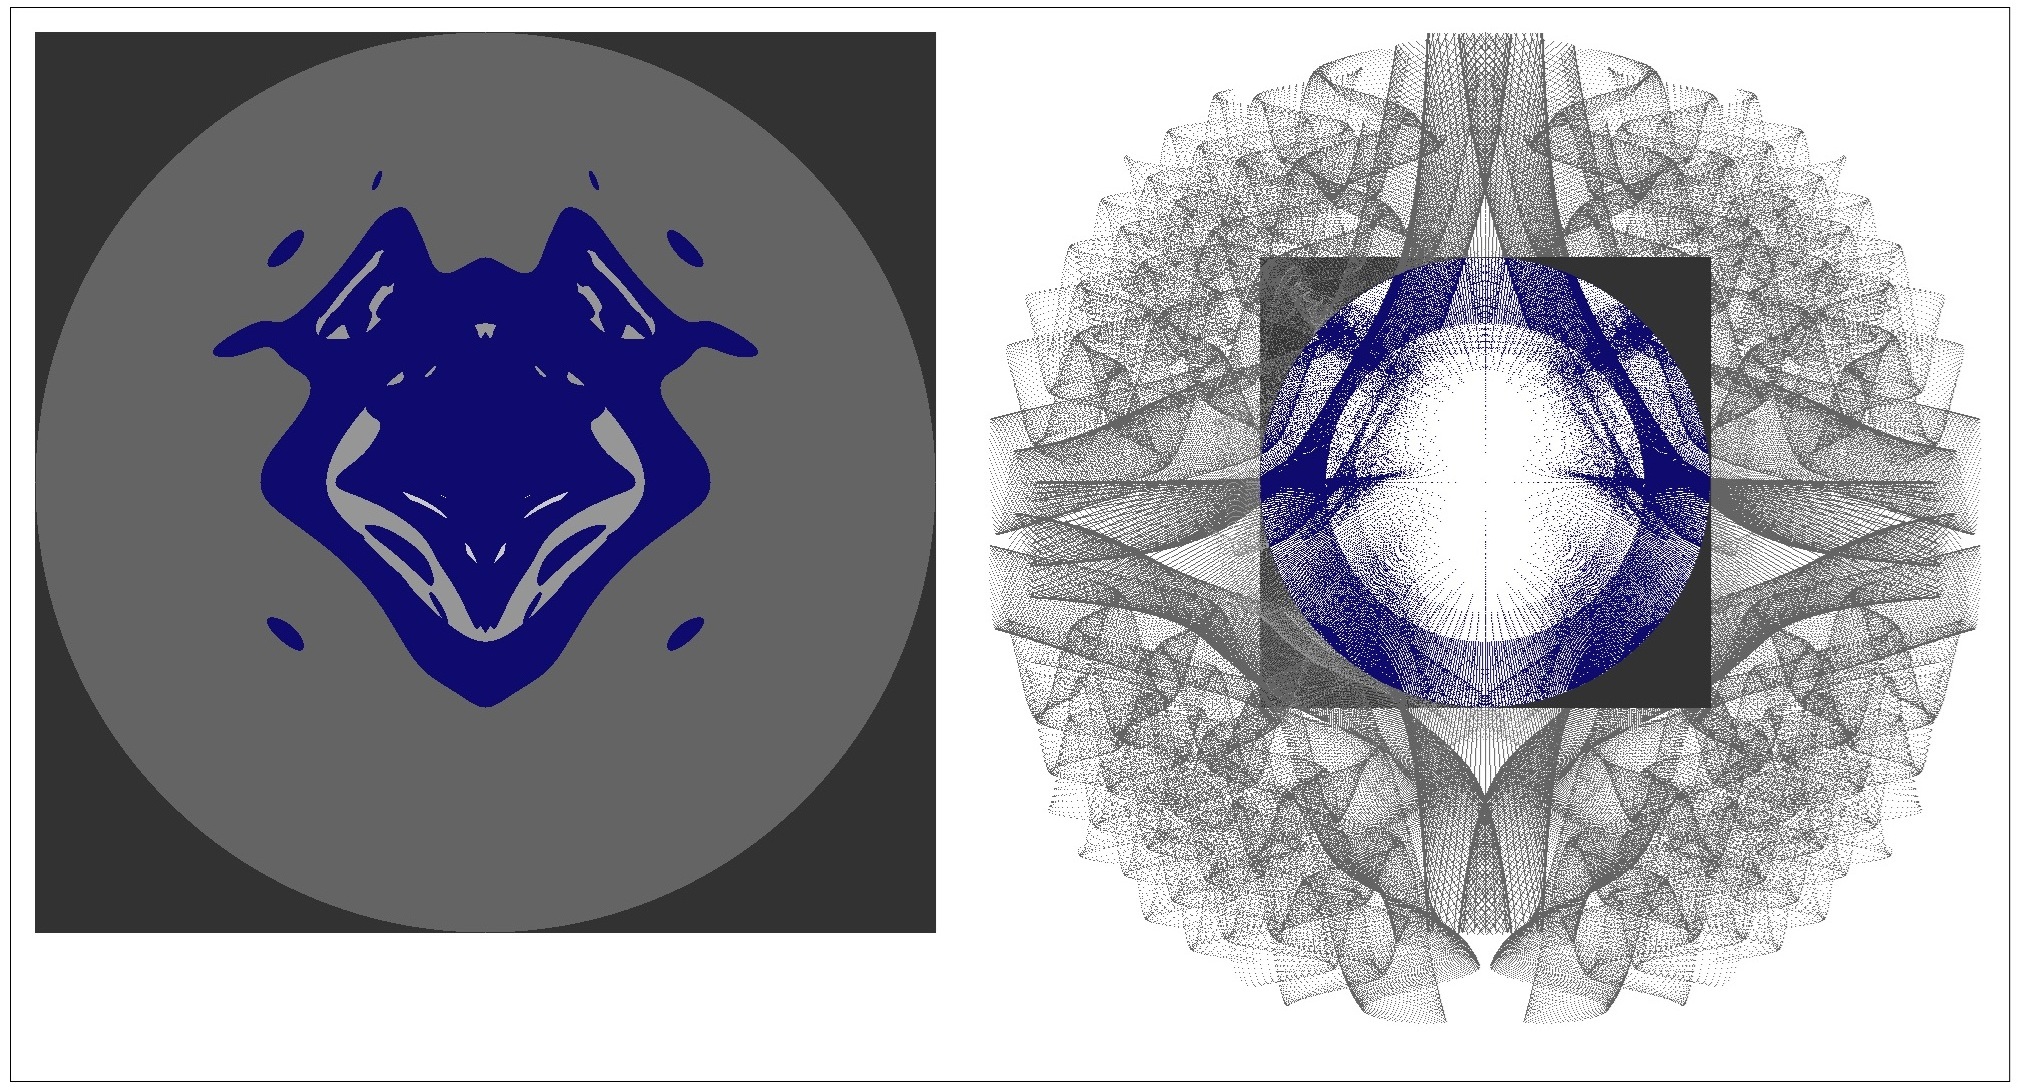
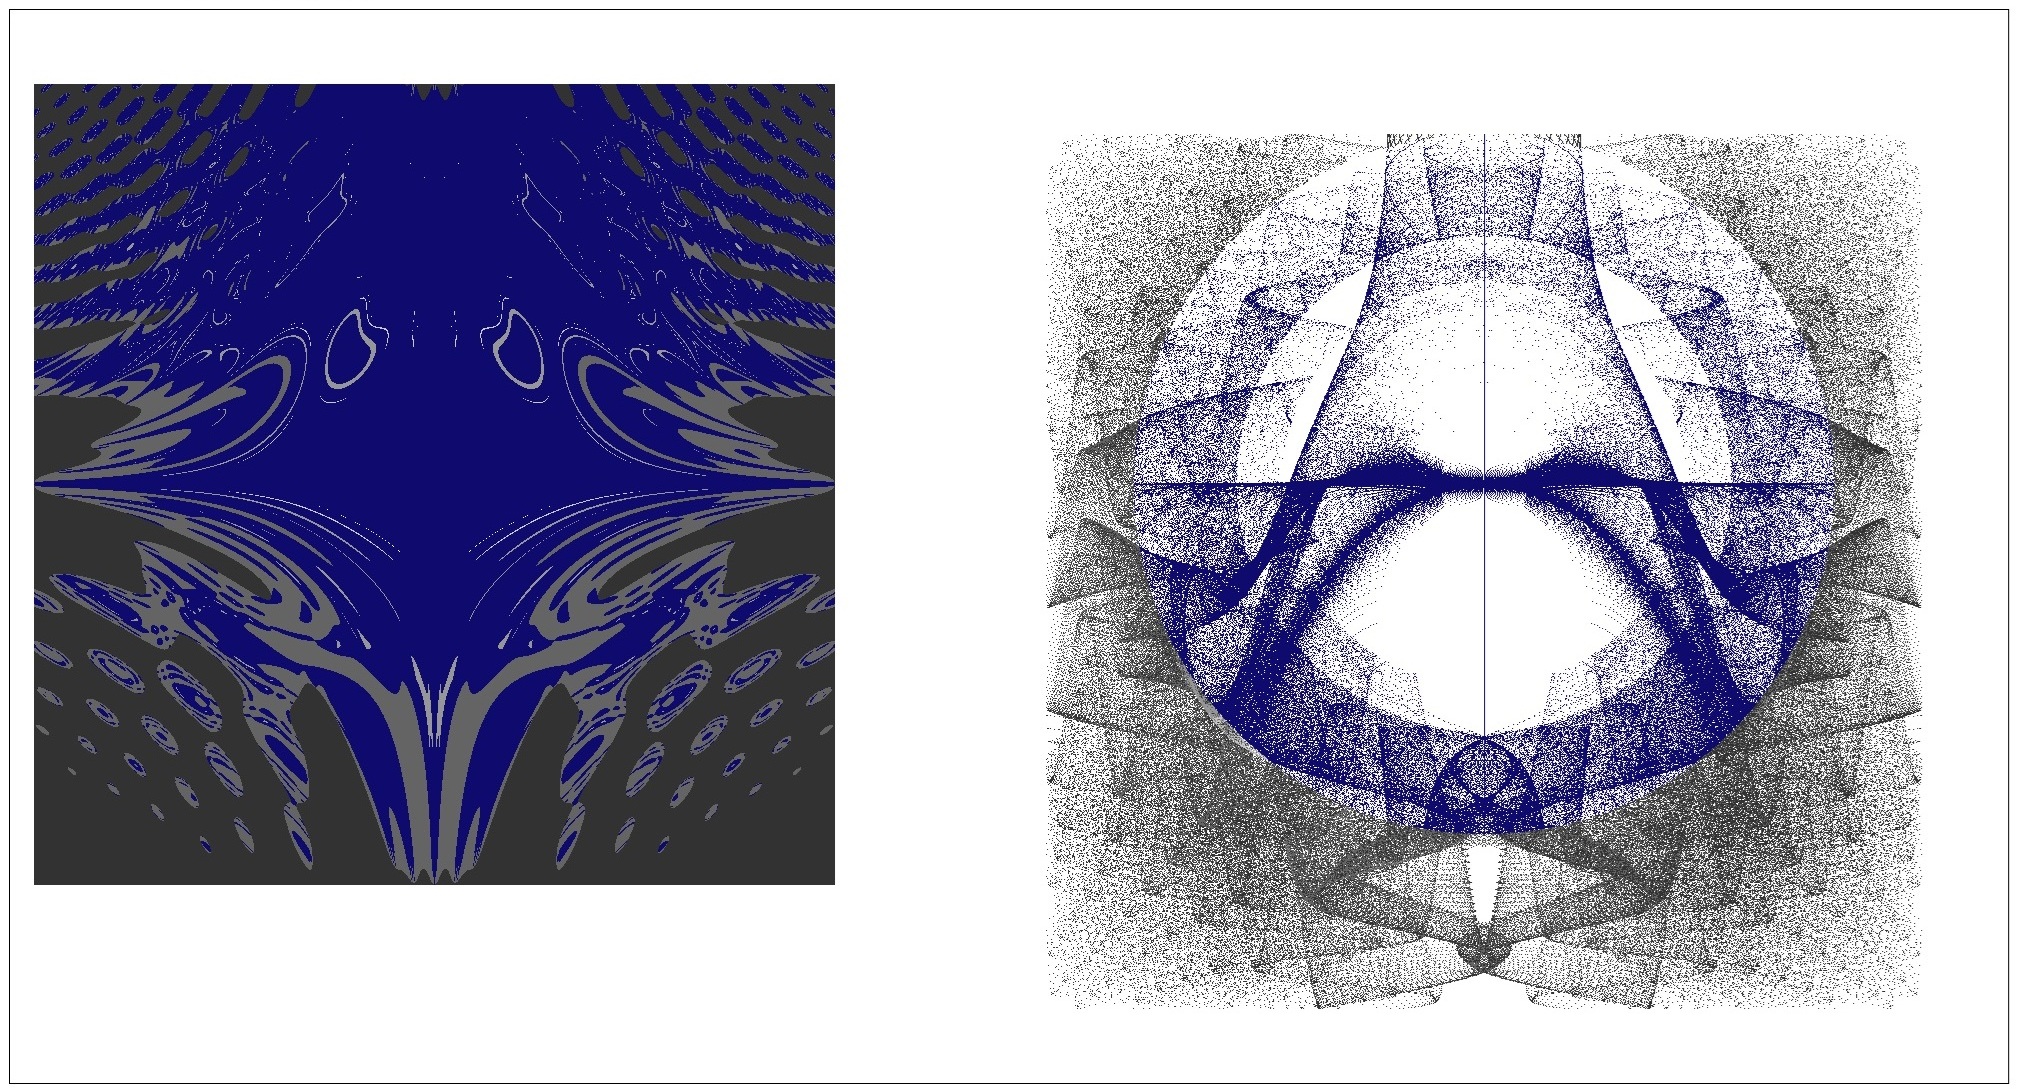
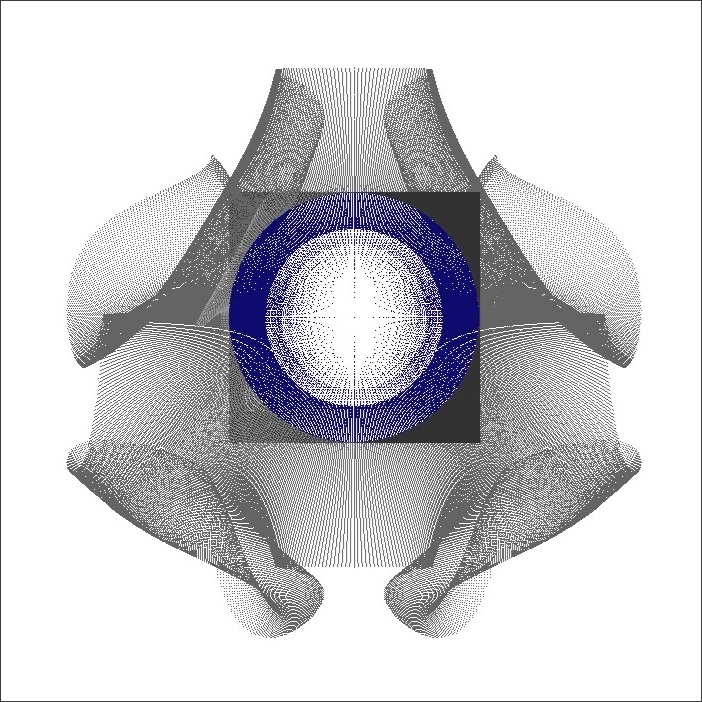
 Julia Point showing Folds Example
- Build: (x+sin(y*x*y)+xs, y+cos(x*x*y)-1.0+ys, (0.0, 0.0))
- Escape: x²+y² > (2.5+m/2.0)²/k
for (int m = 0; m ≤ 4; m++)
{
	for (int i = 0; i ≤ 500+m*100; i++)
	{
		for (int j = 0; j ≤ 500+m*100; j++)
		{
			xs = 0.0;
			ys = 0.0;
			x = -2.5 - m/2.0 + (i/100.0);
			y = -2.5 - m/2.0 + (j/100.0);
			k = 0;
			do
			{
				xnew = x + sin(y*x*y) + xs;
				ynew = y + cos(x*x*y) - 1.0 + ys;
				x = xnew;
				y = ynew;
				k = k + 1;
			} while ((k ≤ kmax) && (x²+y² ≤ (2.5+m/2.0)²/k));
			color = gray;
			if (x²+y² ≤ (2.5+m/2.0)²) color = blue;
			PlotPixel(i, j, color);
			PlotPoint(x, y, color);
		}
	}
}