CHAPTER 6.5
Recognizable Fractal Figures with Trigonometric Functions
Under what circumstances do fractal figures remain recognizable with modifications?
How sensitive are fractal figures to change?
Is it possible to determine the fractal generator from the figure?
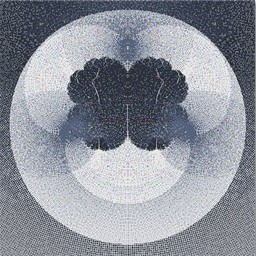
The top Mandelbrot figures and Julia figures (pixel, point, center points) are clearly recognizable as basic shapes.
The bottom left Mandelbrot or Julia figure (pixel) is unrecognizable, while the bottom right Mandelbrot or Julia figures (point, center points) retain basic shapes.
See Chapter 1, Chapter 2, Chapter 3, and Chapter 6 for information on Mandelbrot Sets and Julia Sets.

for (int i = 0; i ≤ 500; i++)
{
	for (int j = 0; j ≤ 500; j++)
	{
		x = 0.0;
		y = 0.0;
		xs = -2.5 + (i / 100.0);
		ys = -2.5 + (j / 100.0);
		k = 0;
		do
		{
Top			xnew = x * x - y * y + xs;
Top			ynew = 2.0 * x * y + ys;
Bottom		        xnew = sin(i - j) + x * x - y * y + xs;
Bottom		        ynew = cos(i - j) + 2.0 * x * y + ys;
			x = xnew;
			y = ynew;
			k = k + 1;
		} while ((k ≤ 64) && (x * x + y * y ≤ 6.25));
		color = gray;
		if (x * x + y * y ≤ 6.25) color = blue;
		PlotPixel(i, j, color);
		PlotPoint(x, y, color);
		PlotCenterPoints(x, y, color);
	}
}


| Mandelbrot | Build: (f(x,y), g(x,y)) | Escape: h(x,y)>value | Plot |
|---|---|---|---|
| Basic Mandelbrot Set Top | (x² - y², 2.0*x*y) | x² + y² > 6.25 | Pixel, Point, Center |
| Basic Mandelbrot Set Bottom | (x² - y² + sin(i-j), 2.0*x*y + cos(i-j)) | x² + y² > 6.25 | Pixel, Point, Center |
| Mandelbrot Variant #1 Top | (x*y², -y*x²) | x³ + y² > 6.25 | Pixel, Point, Center |
| Mandelbrot Variant #1 Bottom | (x*y² + sin(i-j), -y*x² + cos(i-j)) | x³ + y² > 6.25 | Pixel, Point, Center |
| Mandelbrot Variant #2 Top | (sin(y*x²) + x, y + sin(x*y² + x)) | x³ + y² > 6.25/(k*k*k) | Pixel, Point, Center |
| Mandelbrot Variant #2 Bottom | (sin(i-j) + sin(y*x²) + x, y + sin(x*y² + x)) | x³ + y² > 6.25/(k*k*k) | Pixel, Point, Center |

for (int i = 0; i ≤ 500; i++)
{
	for (int j = 0; j ≤ 500; j++)
	{
		xs = 0.0;
		ys = 0.0;
		x = -2.5 + (i / 100.0);
		y = -2.5 + (j / 100.0);
		k = 0;
		do
		{
Top			xnew = x * x - y * y + xs;
Top			ynew = 2.0 * x * y + ys;
Bottom		        xnew = sin(i - j) + x * x - y * y + xs;
Bottom		        ynew = cos(i - j) + 2.0 * x * y + ys;
			x = xnew;
			y = ynew;
			k = k + 1;
		} while ((k ≤ 64) && (x * x + y * y ≤ 6.25));
		color = gray;
		if (x * x + y * y ≤ 6.25) color = blue;
		PlotPixel(i, j, color);
		PlotPoint(x, y, color);
		PlotCenterPoints(x, y, color);

    }
}


| Julia | Build: (f(x, y), g(x, y), (xs, ys)) | Escape: h(x, y)>value | Plot |
|---|---|---|---|
| Basic Julia Set (0.0, 0.0) Top | (x² - y², 2.0*x*y), (0.0, 0.0) | x² + y² > 6.25 | Pixel, Point, Center |
| Basic Julia Set (0.0, 0.0) Bottom | (x² - y² + sin(i-j), 2.0*x*y + cos(i-j)), (0.0, 0.0) | x² + y² > 6.25 | Pixel, Point, Center |
| Julia Variant #1 Top | (x*y², -y*x²), (0.0, 0.0) | x² + y² > 6.25 | Pixel, Point, Center |
| Julia Variant #1 Bottom | (x*y² + sin(i-j), -y*x² + cos(i-j)), (0.0, 0.0) | x² + y² > 6.25 | Pixel, Point, Center |
| Julia Variant #2 Top | (sin(x²*y) + x, y + sin(x*y² + x)), (0.0, 0.0) | x² + y² > 6.25/(k*k*k) | Pixel, Point, Center |
| Julia Variant #2 Bottom | (sin(i-j) + sin(x²*y) + x, y + sin(x*y² + x)), (0.0, 0.0) | x² + y² > 6.25/(k*k*k) | Pixel, Point, Center |
 FRACTAL FIND