 FRACTAL FIND
CHAPTER 8
State Changes for Mandelbrot Quantum Fractal Two Spin-1 Device
Two Spin-1 systems are extracted from a single Mandelbrot construction.
The first spin, zⱼ, reflects state changes in the y-direction.
The second spin, zᵢ, reflects state changes in the x-direction.
Each pixel has a state change of {-, 0, +} associated wth it for each spin.
The spins and associated pseudocode are shown below.
Quantum notation is shown using a modified form of Feynman's Dirac notations:
|+X>, |0X>, |-X> denotes x-direction where real values are on the x-axis.
|+Y>, |0Y>, |-Y> denotes y-direction where imaginary values are on the y-axis.
|+Z>, |0Z>, |-Z> denotes z-direction where changes in state are on the z-axis.
zᵢ=△kᵢ
zⱼ=△kⱼ
The state change is {-, 0, +}
If zⱼ≠0, the state has changed in the y-direction.
If zᵢ≠0, the state has changed in the x-direction.
Since the current graphs show only two dimensions, the state change is reflected in colors.
zⱼ≠0 and zᵢ≠0 are plotted separately in the graphs below.
zⱼ and zᵢ are also plotted to show magnitude.
Resource for Dirac Notation:
Feynman, Richard et al. Feynman Lectures on Physics Volume 3 Quantum Mechanics. NY: Basic Books, 2010, New Millenium Edition.

- Each pixel, p, requires two values to calculate the state change.
-
No pixel can have two states or two state changes in a direction.
There is a single state and a single state change per pixel in each direction. - For a complete state change map (-m to +m, -n to +n), pixels range from (-m-1 to m+1, -n-1 to n+1).
- Pixels have width = 1.0 units and height = 1.0 units.
- State changes are step functions.
State Change where i = -m-1 or j = -n-1
For the y-direction, p(x, -n-1) and zⱼ = z(x, -n-1) = k(x, -n-1)
For the x-direction, p(-m-1, y) and zᵢ = z(-m-1, y) = k(-m-1, y)
State Change where -m ≤ i ≤ m+1 or -n ≤ j ≤ n+1
For the y-direction, p(x, j) and zⱼ = z(x, j) = k(x, j) - k(x, j-1)
For the x-direction, p(i, y) and zᵢ = z(i, y) = k(i, y) - k(i-1, y)
State Change Totals for {-, 0, +} where -m-1 ≤ i ≤ m+1 or -n-1 ≤ j ≤ n+1
Each time the state changes, a total state change count {-, 0, +} is also incremented:
For the y-direction, zⱼ total count for {-, 0, +} increases over |-Y>, |0Y>, |+Y> respectively.
For the x-direction, zᵢ total count for {-, 0, +} increases over |-X>, |0X>, |+X> respectively.
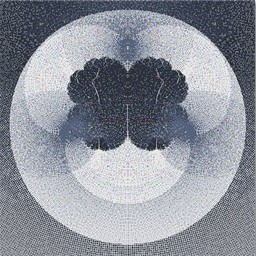
Here is pseudocode and the resulting graph for the Mandelbrot set where (x² - y², 2.0*x*y) is the build. x remains constant while △kⱼ = zⱼ in the y-direction is calculated. Each pixel referenced by the start point(i, j) is plotted when zⱼ ≠ 0.


for (int i = -251; i ≤ 251; i++)
{
	oldk = 0;
	for (int j = -251; j ≤ 251; j++)
	{
		x = 0.0;
		y = 0.0;
		xs = i / 100.0;
		ys = j / 100.0;
		k = 0;
		do
		{
			k = k + 1;
			xnew = x * x - y * y + xs;
			ynew = 2.0 * x * y + ys;
			x = xnew;
			y = ynew;
		} while ((k ≤ 24) && (x * x + y * y ≤ 6.25));
		if (k != oldk) PlotPixel(i, j, color));
		oldk = k;
	}
}

| Section | {-} | {0} | {+} | Sum | |
|---|---|---|---|---|---|
| y1 | 382 | 59508 | 3111 | 63001 | 24.90 |
| y2 | 0 | 195 | 56 | 251 | 0.10 |
| y3 | 2916 | 59703 | 382 | 63001 | 24.90 |
| y4 | 8 | 217 | 26 | 251 | 0.10 |
| y5 | 0 | 1 | 0 | 1 | 0.00 |
| y6 | 25 | 218 | 8 | 251 | 0.10 |
| y7 | 233 | 61468 | 1300 | 63001 | 24.90 |
| y8 | 3 | 247 | 1 | 251 | 0.10 |
| y9 | 1050 | 61715 | 236 | 63001 | 24.90 |
| Sum | 4617 | 243272 | 5120 | 253009 | 100.00 |
| % | 1.82 | 96.15 | 2.02 | 100.00 |
Here is pseudocode and the resulting graph for the Mandelbrot set where (x² - y², 2.0*x*y) is the build. y remains constant while △kᵢ = zᵢ in the x-direction is calculated. Each pixel referenced by the start point(i, j) is plotted when zᵢ ≠ 0.


for (int j = -251; j ≤ 251; j++)
{
	oldk = 0;
	for (int i = -251; i ≤ 251; i++)
	{
		x = 0.0;
		y = 0.0;
		xs = i / 100.0;
		ys = j / 100.0;
		k = 0;
		do
		{
			k = k + 1;
			xnew = x * x - y * y + xs;
			ynew = 2.0 * x * y + ys;
			x = xnew;
			y = ynew;
		} while ((k ≤ 24) && (x * x + y * y ≤ 6.25));
		if (k != oldk) PlotPixel(i, j, color);
		oldk = k;
	}
}

| Section | {-} | {0} | {+} | Sum | |
|---|---|---|---|---|---|
| x1 | 653 | 59933 | 2415 | 63001 | 24.90 |
| x2 | 25 | 218 | 8 | 251 | 0.10 |
| x3 | 1416 | 61444 | 141 | 63001 | 24.90 |
| x4 | 0 | 245 | 6 | 251 | 0.10 |
| x5 | 0 | 1 | 0 | 1 | 0.00 |
| x6 | 16 | 235 | 0 | 251 | 0.10 |
| x7 | 653 | 59933 | 2415 | 63001 | 24.90 |
| x8 | 25 | 218 | 8 | 251 | 0.10 |
| x9 | 1416 | 61444 | 141 | 63001 | 24.90 |
| Sum | 4204 | 243671 | 5134 | 253009 | 100.00 |
| % | 1.66 | 96.31 | 2.03 | 100.00 |